Elasticity (Edexcel A-Level Economics A): Revision Notes
Elasticity
Introduction to elasticity
Elasticity is a fundamental concept in economics that measures how sensitive one variable is to changes in another variable. When we analyse markets, we often want to know more than just the direction of a change - we want to understand the magnitude of the response. For example, if the price of a product falls, we know that quantity demanded will increase (the law of demand), but by how much? Elasticity provides the answer to this question.
The concept of elasticity is particularly useful for predicting how market equilibrium will change in response to shifts in market conditions. It helps firms make pricing decisions and assists governments in forecasting the effects of taxes, subsidies, and other policies.
Price elasticity of demand
Understanding price elasticity of demand
Price elasticity of demand (PED) measures how sensitive the quantity demanded of a good or service is to a change in its price. It tells us the proportionate change in quantity demanded that results from a proportionate change in price.
The formula for PED is:
More formally, we can write this as:
where means 'change in', represents quantity, and represents price.
Because price and quantity demanded move in opposite directions (due to the inverse relationship shown by the demand curve), the PED will always be negative. However, economists often focus on the numerical value and ignore the minus sign when discussing whether demand is elastic or inelastic.
Calculating price elasticity of demand
To calculate PED, we need to work out the percentage changes in both quantity demanded and price, then divide one by the other.
Worked Example: Pencil Demand
Consider the market for pencils. When the price is 40p, quantity demanded is 20 pencils per period. If the price falls to 35p, quantity demanded rises to 30 pencils.
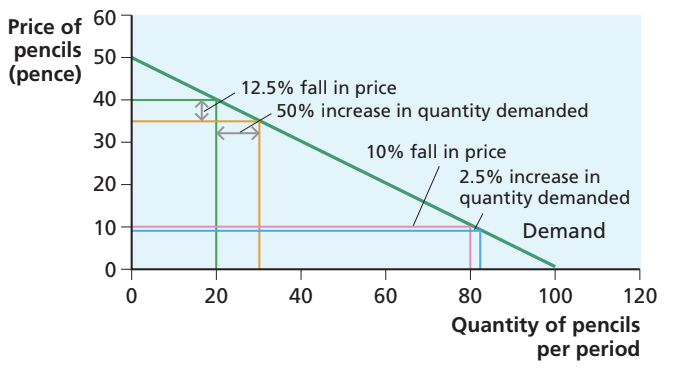
Calculating the elasticity:
Step 1: Calculate the percentage change in quantity
- Change in quantity =
- Percentage change =
Step 2: Calculate the percentage change in price
- Change in price =
- Percentage change =
Step 3: Calculate PED
At this price, demand is highly price elastic (ignoring the minus sign, the value is greater than 1).
Now consider a different section of the same demand curve. When price falls from 10p to 9p, quantity demanded rises from 80 to 82 pencils.
- Percentage change in quantity =
- Percentage change in price =
At this lower price, demand is price inelastic (the numerical value is less than 1).
Interpreting PED values
The numerical value of PED tells us how responsive demand is to price changes:
| PED value | Classification | Meaning |
|---|---|---|
| PED = 0 | Perfectly inelastic | Quantity demanded does not change at all when price changes |
| 0 < PED < 1 | Price inelastic | Percentage change in quantity demanded is smaller than percentage change in price |
| PED = 1 | Unit price elastic | Percentage change in quantity demanded equals percentage change in price |
| 1 < PED < ∞ | Price elastic | Percentage change in quantity demanded is larger than percentage change in price |
| PED = ∞ | Perfectly elastic | Consumers demand an unlimited quantity at the current price, but demand falls to zero if price rises |
When demand is elastic, consumers are highly responsive to price changes. A small change in price leads to a large change in quantity demanded. For example, if a 2% price increase causes a 5% fall in quantity demanded, the elasticity is (ignoring the sign, this is greater than 1), so demand is elastic.
When demand is inelastic, consumers are not very responsive to price changes. Even a significant price change produces only a small change in quantity demanded. For example, if a 2% price increase causes only a 1% fall in quantity demanded, the elasticity is (the numerical value is less than 1), so demand is inelastic.
When demand is unitary elastic, the percentage changes in price and quantity are exactly equal in magnitude, giving an elasticity of exactly (or 1 in absolute terms).
Exam tip: The PED is always negative because of the inverse relationship between price and quantity demanded. However, economists often omit the minus sign and focus just on the numerical value when classifying demand as elastic or inelastic. Make sure you understand what is meant by elastic and inelastic demand, and how these are defined numerically.
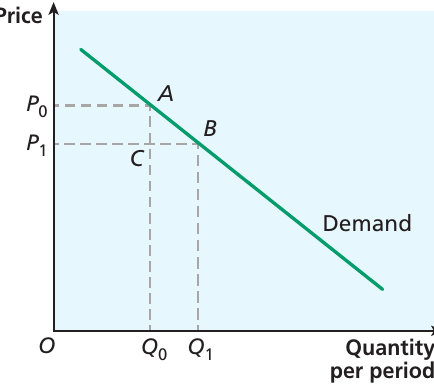
How PED varies along a demand curve
An important characteristic of a straight-line demand curve is that the price elasticity varies at different points along the curve. This happens even though the slope remains constant throughout.
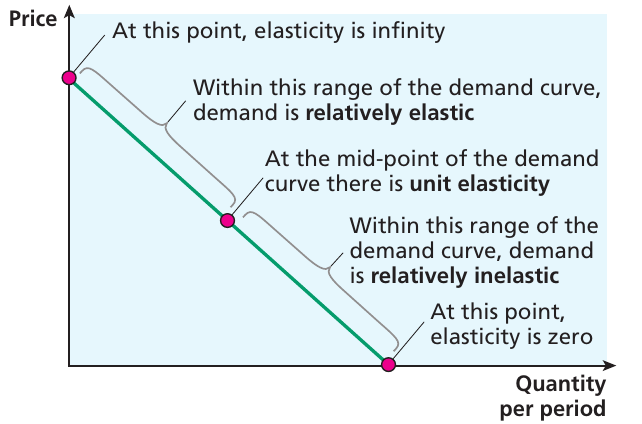
At the top of the demand curve (where price is relatively high and quantity relatively low):
- Elasticity approaches infinity (perfectly elastic)
- The upper portion of the curve is relatively elastic
At the midpoint of the demand curve:
- Elasticity equals (unit elastic)
- This is the point of unit elasticity
At the bottom of the demand curve (where price is relatively low and quantity relatively high):
- Elasticity approaches zero (perfectly inelastic)
- The lower portion of the curve is relatively inelastic
Why does this happen? The key is to remember that elasticity is defined in terms of percentage changes, not absolute changes. When price is relatively high, quantity is relatively low. A small absolute change in price represents a small percentage change, but the same absolute change in quantity represents a large percentage change. This makes elasticity high. Conversely, when price is low and quantity high, the ratio reverses, making elasticity low.
You should only calculate elasticity for relatively small changes in price, as it becomes unreliable for very large changes. Also, you cannot describe a straight-line demand curve as either elastic or inelastic overall - elasticity varies along the curve. It is the point on the curve (or the specific price level) at which elasticity is measured that determines whether demand is elastic or inelastic at that point.
Perfectly elastic and perfectly inelastic demand
Two extreme cases deserve special mention:
Perfectly inelastic demand (PED = 0)
When demand is perfectly inelastic, quantity demanded does not change at all in response to a price change. The demand curve is vertical. Consumers demand exactly the same quantity regardless of price. This situation is very rare in practice, though demand for some life-saving medicines might come close.
Perfectly elastic demand (PED = infinity)
When demand is perfectly elastic, consumers demand an unlimited quantity at the prevailing price, but if price rises even slightly above this level, demand falls to zero. The demand curve is horizontal. This can occur when there are perfect substitutes available at a fixed price - consumers will buy entirely from the cheapest source.
Factors that influence price elasticity of demand
Several factors determine whether demand for a good or service will be elastic or inelastic:
1. Availability of substitutes
This is the most important factor. Goods that have close substitutes available tend to have more elastic demand. When the price of one product rises, consumers can easily switch to an alternative.
For example, cauliflower and broccoli are often seen as similar vegetables. If the price of cauliflower rises significantly one week, consumers might readily switch to broccoli instead. The demand for cauliflower is relatively price elastic because there are close substitutes available.

On the other hand, if the price of all vegetables rises together, demand will not change very much, as there are no close substitutes for vegetables in the diet. Goods with no close substitutes tend to have more inelastic demand.
2. Necessity versus luxury
If a good is regarded as a necessity, demand tends to be inelastic. Consumers feel they must continue purchasing it even when the price rises. However, if a good is regarded as a luxury item, consumers are more price sensitive and demand tends to be more elastic. They can choose to cut back or go without when prices rise.
This is closely related to the availability of substitutes. Labelling something as a necessity is essentially saying there are no substitutes for it.
3. Proportion of income spent on the good
Goods that represent a small proportion of overall expenditure tend to have inelastic demand. Consumers may not notice small changes in the price of inexpensive items such as salt or sugar, so their purchasing behaviour remains largely unchanged.
Conversely, items that figure large in the household budget (such as housing, cars, or holidays) tend to have more elastic demand. When a significant proportion of income is involved, consumers are much more sensitive to price changes.
4. Time period
The elasticity of demand tends to be more elastic in the long run than in the short run. When prices change, consumers may initially have limited ability to adjust their consumption. Habits and commitments may dictate consumption patterns in the short run.
However, over a longer time period, consumers can make adjustments. For example, an increase in the price of petrol may have limited effects in the short run if people are committed to driving to work. In the long run, however, consumers may buy smaller, more fuel-efficient cars, switch to electric vehicles, or even make greater use of public transport. These adjustments mean demand becomes more elastic over time.
Study tip: Be ready to identify these four key influences on PED: the availability of close substitutes, whether the good is perceived as a necessity or luxury, the proportion of income spent on the good, and the time period over which elasticity is considered.
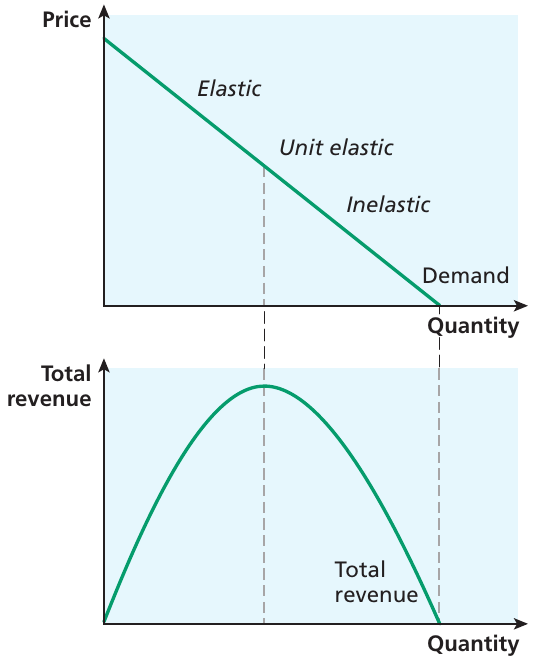
Price elasticity of demand and total revenue
Understanding the relationship between PED and total revenue is crucial for firms making pricing decisions. Total revenue is calculated as price multiplied by quantity sold.
When a firm changes its price, two opposing effects occur:
- The price effect: revenue per unit changes
- The quantity effect: the number of units sold changes
Which effect dominates depends on the price elasticity of demand.
When demand is elastic:
If demand is elastic, the percentage change in quantity is larger than the percentage change in price. Therefore:
- A price decrease leads to a rise in total revenue (the increase in quantity more than compensates for the lower price)
- A price increase leads to a fall in total revenue (the decrease in quantity more than offsets the higher price)
When demand is inelastic:
If demand is inelastic, the percentage change in quantity is smaller than the percentage change in price. Therefore:
- A price increase leads to a rise in total revenue (the higher price more than compensates for the fall in quantity)
- A price decrease leads to a fall in total revenue (the lower price is not offset by the increase in quantity)
When demand is unit elastic:
When elasticity equals , the percentage changes in price and quantity are exactly equal. Therefore:
- Total revenue does not change when price changes
The relationship is summarised in this table:
| Price elasticity of demand | For a price increase, total revenue... | For a price decrease, total revenue... |
|---|---|---|
| Elastic | falls | rises |
| Unit elastic | does not change | does not change |
| Inelastic | rises | falls |
Worked Example: Revenue Changes with Elasticity
Using the pencil demand curve from earlier, we can see this relationship in action.
In the elastic region: When price fell from 40p to 35p:
- Original revenue =
- New revenue =
- Revenue increased because demand was elastic
In the inelastic region: When price fell from 10p to 9p:
- Original revenue =
- New revenue =
- Revenue fell because demand was inelastic
For a straight-line demand curve, total revenue rises as price falls in the elastic portion of the curve. Revenue reaches its maximum at the midpoint (unit elasticity), then falls as price continues to decrease into the inelastic portion.
Exam tip: A firm will be eager to know the extent to which demand for its product responds to price changes. If demand is elastic, raising prices would be unwise because revenue would fall. Understanding PED helps firms make strategic pricing decisions.
Income elasticity of demand
Understanding income elasticity of demand
While PED measures sensitivity to price changes, income elasticity of demand (YED) measures how sensitive quantity demanded is to changes in consumer incomes. This helps economists distinguish between different types of goods.
The formula for YED is:
Unlike PED, the income elasticity of demand can be either positive or negative, depending on the nature of the good.
Normal goods and inferior goods
For normal goods, quantity demanded increases as consumer income rises. Therefore, YED is positive. Most goods and services fall into this category - as people become wealthier, they buy more of these products.
For inferior goods, quantity demanded falls as consumer income rises. Therefore, YED is negative. These are goods that consumers choose to buy less of when they can afford better alternatives. Examples might include cheap own-brand products, fast food, or budget accommodation that people replace with superior options as their income increases.
Necessities and luxury goods
Among normal goods (those with positive YED), we can make a further distinction:
Necessities are goods with a YED that is positive but less than 1. As income rises, consumers do spend more on these goods, but proportionally less of their income. The quantity demanded rises less than proportionately with income. These are goods that consumers need but don't greatly increase consumption of when they become wealthier.
Worked Example: Necessity
Suppose the YED for cheese is 0.2. If consumer incomes increase by 10%, demand for cheese would increase by only 2% (). This suggests cheese is a necessity - people continue to buy it as incomes rise, but they don't devote an increasing share of their budget to it.
Luxury goods are goods with a YED greater than 1. As income rises, consumers spend proportionally more on these goods. They are income elastic - people devote an increasing share of their income to these products as they become wealthier.
Worked Example: Luxury Good
Suppose the YED for smartphones is . This means that for every 10% increase in incomes, the quantity demanded of smartphones increases by 20%. People are devoting more of their income to this product as they become wealthier, indicating it is a luxury good. Demand is income elastic.
Exam tip: Remember that whether a good is regarded as a necessity or luxury can vary between different consumers. A good that is viewed as a luxury by some people (such as a second car) might be viewed differently by wealthy households. When interpreting YED values, consider the context and the consumer group being studied.
Interpreting YED values
The following table summarises the interpretation of YED values:
| YED value | Description | Meaning |
|---|---|---|
| YED < -1 | Income-elastic inferior good | Quantity demanded falls sharply as income rises |
| -1 < YED < 0 | Income-inelastic inferior good | Quantity demanded falls slightly as income rises |
| YED = 0 | No relationship | Quantity demanded does not change with income |
| 0 < YED < 1 | Income-inelastic normal good (necessity) | Quantity demanded rises less than proportionately with income |
| YED > 1 | Income-elastic normal good (luxury) | Quantity demanded rises more than proportionately with income |
Worked Example: Inferior Good
If the YED for coach travel is , this indicates it is an inferior good. A 10% increase in consumer incomes would lead to a 3% fall in demand for coach travel, perhaps because more people choose to travel by car or train instead.
Cross elasticity of demand
Understanding cross elasticity of demand
Cross elasticity of demand (XED) measures the sensitivity of quantity demanded of one good to a change in the price of another good or service. This elasticity reveals the relationship between goods.
The formula for XED is:
Like YED, the cross elasticity can be either positive or negative, and the sign provides important information about the relationship between the goods.
Substitutes and complements
When the XED is positive, the two goods are substitutes. An increase in the price of good Y leads to an increase in the quantity demanded of good X. Consumers switch from the now-more-expensive good Y to the alternative good X.
For example, if the price of apples rises, the demand for pears may increase. Apples and pears are substitutes - if one becomes relatively more expensive, consumers switch to the other.
A high positive value for XED indicates that two goods are very close substitutes. This information can help firms identify their close competitors.
When the XED is negative, the two goods are complements. An increase in the price of good Y leads to a decrease in the quantity demanded of good X. These goods tend to be consumed together, so if one becomes more expensive and its demand falls, demand for the complementary good also falls.
For example, coffee and sugar tend to be consumed together. If the XED between these goods is negative, it confirms they are complements. When the price of coffee rises and people buy less coffee, they also buy less sugar.
Interpreting XED values
The following table summarises the interpretation of XED values:
| XED value | Description | Meaning |
|---|---|---|
| XED < -1 | Strong complement | Goods are strongly complementary |
| -1 < XED < 0 | Weak complement | Goods are weak complements |
| XED = 0 | Unrelated | No relationship between the goods |
| 0 < XED < 1 | Weak substitute | Goods are weak substitutes |
| XED > 1 | Strong substitute | Goods are strong substitutes |
An XED of zero indicates that the goods are unrelated - they are neither substitutes nor complements. A change in the price of one good has no effect on demand for the other.
Using elasticities
The various elasticity measures are valuable tools for both firms and governments in their decision making.
For firms:
Suppose you are responsible for setting prices for a product. Understanding PED is crucial:
- If demand is elastic, you would hesitate to raise prices because this would reduce total revenue
- If demand is inelastic, raising prices could increase revenue
- Knowing the YED helps forecast changing demand if real incomes are rising or if the economy is heading into recession
- Understanding the XED helps anticipate changes in demand when competitors change their prices or when the prices of complementary goods change
For governments:
Elasticity measures help governments assess the likely impact of policies:
- When imposing an indirect tax, the government can use PED to forecast the resulting tax revenues
- If the government introduces a subsidy to reduce the selling price of a good, knowing the PED allows them to assess the impact of this policy
- Understanding YED helps predict how demand patterns will change as the economy grows and incomes rise
- This information is valuable for planning public services and infrastructure
Real-World Application: Wine Pricing
A study by the Institute for Fiscal Studies found that the price elasticity of demand for wine was . This relatively elastic demand means that if wine prices increase by 10%, quantity demanded would fall by approximately 16.9%. This information is valuable for both wine producers (in making pricing decisions) and for the government (in assessing the impact of alcohol taxes on consumption and revenue).
Key Points to Remember:
-
Price elasticity of demand (PED) measures how responsive quantity demanded is to price changes. It is always negative due to the inverse relationship between price and quantity.
-
Demand is elastic when the numerical value of PED exceeds 1 (ignoring the sign), meaning quantity demanded changes proportionately more than price. Demand is inelastic when PED is less than 1, meaning quantity changes proportionately less than price.
-
Along a straight-line demand curve, elasticity varies from infinity at high prices to zero at low prices, with unit elasticity at the midpoint. You cannot describe such a curve as simply "elastic" or "inelastic" overall.
-
Four key factors affect PED: availability of substitutes, whether the good is a necessity or luxury, the proportion of income spent on it, and the time period considered.
-
When demand is elastic, falling prices increase total revenue; when demand is inelastic, rising prices increase total revenue. This relationship is crucial for firms' pricing strategies.
-
Income elasticity of demand (YED) distinguishes between normal goods (positive YED) and inferior goods (negative YED), and between necessities (YED between 0 and 1) and luxury goods (YED greater than 1).
-
Cross elasticity of demand (XED) identifies substitutes (positive XED) and complements (negative XED), with the magnitude indicating the strength of the relationship.
-
Elasticity measures are practical tools for firms making pricing decisions and for governments forecasting the effects of taxes, subsidies, and other economic policies.