Inflation and Deflation (Edexcel A-Level Economics A): Revision Notes
Inflation and Deflation
Introduction
Inflation is one of the most important indicators of economic performance, alongside economic growth, unemployment, and the balance of payments. Governments need to monitor and control inflation carefully because unstable prices can deter business investment and hinder sustainable economic growth. Understanding how inflation is measured and what causes it is essential for evaluating economic policy effectiveness.
The careful monitoring and control of inflation is crucial because price stability creates a predictable environment for business investment decisions. When prices fluctuate unpredictably, businesses become hesitant to make long-term investment commitments, which can slow economic growth and reduce job creation.
What is inflation?
Inflation refers to a sustained rise in the general price level in an economy. When inflation occurs, the purchasing power of money decreases, meaning that each pound buys fewer goods and services than before.
The key word here is "sustained" – inflation is not just a one-off price increase, but a continuing upward trend in prices over time. To measure inflation, economists first need to calculate the average price level in the economy, then track how this changes over time as a percentage rate.
Understanding index numbers
Before exploring specific measures of inflation, it's important to understand how index numbers work. An index number helps us track changes in prices over time by comparing current prices to a base year.
Here's how it works:
- A representative basket of goods and services is selected to reflect typical household spending
- The cost of this basket is calculated in a chosen base year, which is set equal to 100
- In subsequent years, the cost of the same basket is measured and expressed relative to the base year
- This shows the percentage change in prices since the base year
Worked Example: Calculating an Index Number
Suppose a basket of goods costs $1,000 in the base year (index = 100).
In the following year, the same basket costs $1,025.
To calculate the new index:
This index of 102.5 indicates a 2.5% increase in prices since the base year.
The consumer price index (CPI)
The consumer price index (CPI) has been the UK government's preferred measure of inflation since January 2004 and is used to set the official inflation target of 2% per annum.
How the CPI is compiled
The CPI is based on tracking the prices of a large basket of goods and services that represents typical household consumption:
- The Office for National Statistics (ONS) collects approximately 180,000 individual price quotes every month
- These prices cover over 700 different products and services
- Data is gathered through shop visits, telephone surveys, and online collection methods
- During the COVID-19 pandemic, in-store collection was adjusted and supplemented with alternative methods
In November 2021, the ONS announced plans to expand data collection by using scanners in shops and web-scraping techniques to capture millions of additional price observations. This enhancement was implemented by the first quarter of 2023, significantly improving the accuracy and comprehensiveness of price tracking.
Weighting the basket
The items in the CPI basket are not all given equal importance. Instead, they are weighted according to how much households typically spend on each category. These weights come from the Household Final Monetary Consumption Expenditure survey and are updated annually to reflect changing consumption patterns.
The basket itself is also reviewed regularly. For instance, in 2022, several new items were added (including meat-free sausages, sports bras, and antibacterial surface wipes) while others were removed (such as doughnuts and coal) to ensure the index remains representative of modern spending habits.
The annual updates to the CPI basket reflect how consumer preferences and lifestyles evolve over time. The addition of items like meat-free sausages shows the growing trend toward plant-based diets, while the removal of coal reflects its declining use in UK households. These regular updates help ensure the index accurately captures the "average" household's spending experience.
The CPI measures price levels, not inflation
It's crucial to understand that the CPI itself measures the level of prices in the economy at a particular point in time. Inflation, on the other hand, is the rate of change of prices. The percentage change in the CPI over 12 months gives us the inflation rate.
This distinction is fundamental: CPI = price level, inflation = rate of change of CPI.
The CPI reflects the experience of the "average" household, but individual households may experience different inflation rates depending on their particular spending patterns. For example, elderly pensioners who have paid off their mortgages may experience inflation differently from younger families still making mortgage payments.
CPIH: including housing costs
A limitation of the original CPI was that it excluded the housing costs faced by homeowners. To address this, a new version called CPIH (Consumer Price Index including Housing) was introduced in March 2013.
CPIH includes:
- The housing costs of owner-occupiers
- Council tax payments
- But excludes mortgage interest payments
Since March 2017, CPIH has been the ONS's headline measure of inflation, though the government's official inflation target is still expressed in terms of CPI.
Alternative measurements of inflation
The retail price index (RPI)
Before the CPI was adopted, the retail price index (RPI) was the UK's traditional measure of inflation. It was first calculated under a different name in the early twentieth century to assess how workers were affected by price changes during the First World War.
When the Labour government came to power in 1997, it set an explicit inflation target using RPIX (the RPI excluding mortgage interest payments). The logic was that if interest rates are used as a tool to control inflation, including mortgage interest in the inflation measure would be misleading – raising interest rates to curb inflation would directly increase the RPI through higher mortgage payments.
The RPI is still published today and is used in some contracts to update pensions and other payments for inflation.
Comparing calculation methods
Both the CPI and RPI follow a similar approach:
- They calculate the overall price level at different points in time
- They are based on the cost of a representative basket of goods and services relative to a base period
- They use the same raw price data collected by the ONS
However, they differ in important ways:
- They use different formulae to combine the prices into an overall index
- They cover different populations – for example, the RPI excludes pensioner households relying primarily on state support and the highest-income households, whereas the CPI includes all households
- They include different items – most notably, the RPI includes mortgage interest payments while the CPI does not
The substitution effect problem
Both indices share a common limitation arising from their use of fixed weights. When one product's price rises sharply, consumers often substitute it with a cheaper alternative. However, because the indices use fixed weights, they don't capture this substitution effect. As a result, they may overstate the true cost of living.
To partially address this, the weights are updated annually to limit the impact of major changes.
In 2022, for example, the basket was updated to include items reflecting changing consumer preferences and to remove items that were becoming less commonly purchased.
Historical trends in UK inflation
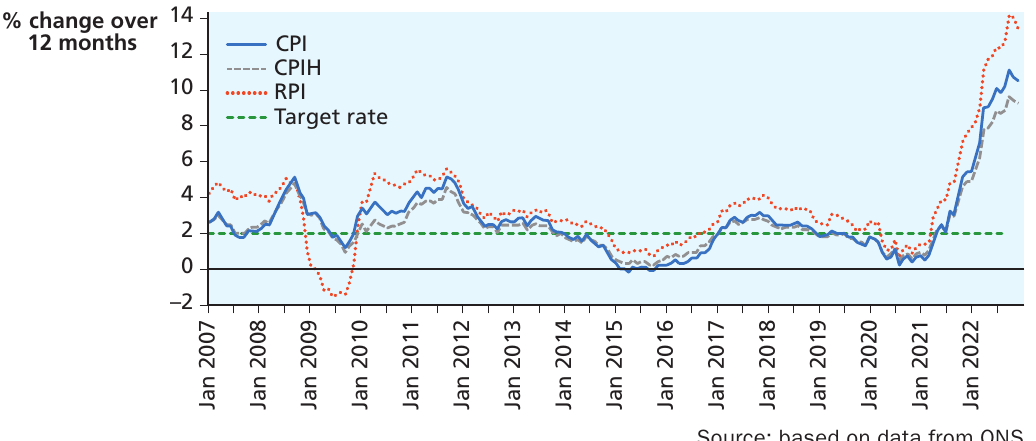
The chart above shows the movements in CPI, CPIH, and RPI from 2007 to 2022, with the government's 2% inflation target shown as a horizontal dashed line.
Key observations from this period include:
2007-2008: Inflation accelerated on all three measures, partly due to rising food prices in global markets, reaching around 5% before the global financial crisis hit.
The period of 2007-2008 saw significant inflationary pressure from commodity markets, particularly food and energy. Global demand was strong, and supply constraints in agricultural markets pushed food prices to record highs, creating cost-push inflation across many economies.
2009: A brief period of negative RPI inflation (deflation) occurred when the economy plummeted into recession. This partly reflected extremely low interest rates, which reduced mortgage interest payments and caused RPI inflation to fall temporarily below zero.
2010-2015: Inflation remained relatively close to the 2% target, with some periods above and below this level.
Until 2003, the government's inflation target was set at 2.5% per annum using the RPIX measure. After that, the target was changed to 2% per annum using CPI. Since 1997, the Bank of England has been responsible for ensuring inflation stays within 1 percentage point of this target.
2016-2020: Inflation again showed some volatility, with CPI and CPIH generally tracking below the RPI.
2021-2022: A dramatic surge in inflation occurred, with all three measures rising sharply. By 2022, CPI and CPIH exceeded 10% while RPI reached approximately 13%. This acceleration happened as the economy expanded after the COVID-19 pandemic and commodity prices increased following the war in Ukraine, which disrupted supply chains.
Why do CPI and RPI differ?
For most of the period shown, the CPI and CPIH have shown a lower rate of change than the RPI. This reflects several factors:
- The different ways in which the prices are combined in the calculation
- The different items and households covered by each index
The fact that RPI went negative in 2009 while CPI remained positive demonstrates how significantly mortgage interest payments can affect the RPI measure. When the Bank of England cut interest rates dramatically during the financial crisis, mortgage payments fell sharply, pulling the RPI down even though other prices continued to rise modestly.
Comparing international inflation
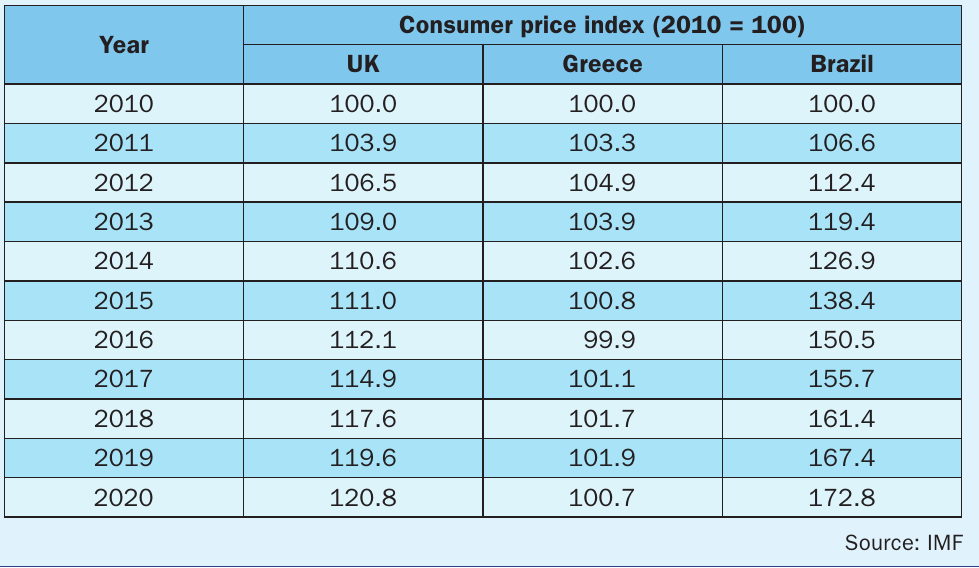
The table above shows consumer price indices for the UK, Greece, and Brazil from 2010 to 2020, with 2010 as the base year (index = 100).
This international comparison reveals:
UK: Experienced steady, moderate inflation with the index rising from 100.0 in 2010 to 120.8 in 2020, representing approximately 21% cumulative inflation over the decade.
Greece: Showed very low or even slightly negative inflation over the period. The index fluctuated around 100-104, actually falling below the baseline to 99.9 in 2016, before ending at 100.7 in 2020. This reflects the severe economic difficulties Greece faced during and after the financial crisis.
Brazil: Experienced much higher inflation, with the index rising sharply from 100.0 to 172.8 by 2020, representing approximately 73% cumulative inflation – much higher than the UK.
This illustrates how inflation experiences can vary dramatically between countries depending on their economic circumstances and policy frameworks. Brazil's higher inflation reflects a combination of currency weakness, fiscal challenges, and supply-side constraints, while Greece's near-zero inflation was associated with economic stagnation and austerity policies following the eurozone crisis.
What causes inflation?
While inflation remained close to its target for much of the 2010s, it accelerated sharply in 2022, becoming a major topic of economic debate. Understanding why inflation emerges is crucial for effective policy responses.
There are two main factors that can cause prices to rise:
Demand-pull inflation
Demand-pull inflation occurs when prices rise as a result of increased demand pressures in the economy.
Demand-Pull Inflation in Action
In 2022, the UK economy was beginning to recover from the disruptions of the COVID-19 pandemic. Consumer demand increased as restrictions were lifted and people started spending more freely again. This surge in demand put upward pressure on prices as businesses struggled to meet the increased consumption.
When demand for goods and services exceeds supply, businesses can raise prices without losing customers, leading to inflation.
Cost-push inflation
Cost-push inflation happens when rising production costs force businesses to increase their prices.
Cost-Push Inflation Factors in 2022
Several supply-side effects contributed to inflation in 2022:
- Supply chain disruptions from the pandemic continued to affect the availability of goods and components
- Brexit had created additional frictions in trade, increasing costs for UK businesses
- The conflict in Ukraine created severe supply-side pressures, particularly affecting oil and gas supplies to Europe
These factors pushed up the costs faced by firms, forcing them to raise prices to maintain profitability. This is cost-push inflation in action.
In reality, the inflation surge of 2022 resulted from a combination of both demand-pull and cost-push factors working together.
Deflation
The recession that began to affect many advanced economies in the late 2000s raised concerns about a different problem: the possibility that prices might actually fall.
Deflation means a fall in the average level of prices – in other words, negative inflation. This should not be confused with disinflation, which refers to a fall in the rate of inflation (prices still rising, but more slowly).
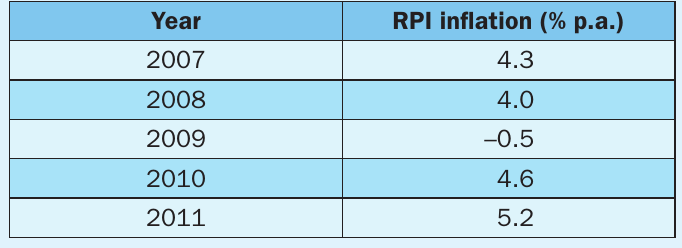
The table above shows RPI inflation in the UK from 2007 to 2011. Notice that in 2009, the RPI inflation rate was -0.5%, indicating deflation. The UK experienced falling prices according to the RPI for a period during the financial crisis.
Why is deflation a concern?
Deflation is sometimes perceived as harmful to the economy because it can signal that the economy is in serious decline. Here's the logic:
If people expect prices to continue falling in the future, they may postpone purchases, thinking they can buy more cheaply later. This reduction in current demand can deepen an economic downturn, creating a self-reinforcing negative spiral. This phenomenon is sometimes called the paradox of thrift – while individuals may benefit from saving and waiting, their collective behaviour worsens the recession.
Can central banks prevent deflation?
Keynesian economic theory suggests that deflation can become entrenched if not addressed. However, central banks have tools to intervene and prevent deflation from becoming long-lived. Through monetary policy actions such as cutting interest rates and quantitative easing, they can stimulate demand and push prices back up.
It's not entirely clear whether consumers would actually behave in the way the theory predicts – many people might simply welcome the opportunity to save more money without significantly changing their spending patterns. Nevertheless, policymakers remain vigilant about the risks of sustained deflation, particularly given the experience of Japan, which suffered from prolonged deflation in the 1990s and 2000s.
Deflation vs disinflation
Study tip: Be careful not to confuse falling prices (deflation) with falling inflation (disinflation).
-
Disinflation means that prices are still rising, just more slowly than before. For example, if inflation falls from 5% to 3%, that's disinflation – prices are still going up, just at a slower rate.
-
Deflation only occurs when the inflation rate becomes negative and prices actually fall.
This is a common source of confusion in economics exams, so make sure you understand the distinction clearly!
Summary
Key Points to Remember:
-
Inflation is a sustained rise in the general price level in an economy, measured as the percentage rate of change of a price index over time.
-
The consumer price index (CPI) has been the UK government's preferred inflation measure since 2004, with a target rate of 2% per annum. It's based on tracking approximately 180,000 price quotes for over 700 products each month.
-
CPIH (Consumer Price Index including Housing) has been the ONS's headline measure since March 2017. It includes owner-occupier housing costs and council tax, making it more comprehensive than CPI.
-
The retail price index (RPI) is the traditional UK inflation measure that includes mortgage interest payments. It tends to show higher inflation than CPI due to differences in coverage and calculation methods.
-
Inflation can be caused by demand-pull factors (increased consumer demand) or cost-push factors (rising production costs from supply disruptions, such as those seen during the pandemic and Ukraine conflict).
-
Deflation (falling prices) is different from disinflation (falling inflation rate). Deflation may signal economic problems and can potentially worsen recessions if consumers delay purchases expecting further price falls.