Measuring Economic Growth (Edexcel A-Level Economics A): Revision Notes
Measuring Economic Growth
GDP, GNI and the standard of living
Understanding GDP and GNI
GDP measures the total value of goods and services produced within an economy during a specific time period. While this provides a useful indicator of economic output, it has limitations when assessing the resources actually available to a country's residents.
When the goal is to evaluate the standard of living in a country, GNI offers a more accurate measure than GDP. GNI more closely reflects the actual incomes enjoyed by residents because it includes net income flows between countries. This distinction becomes particularly important for countries like Pakistan or the Philippines, where significant amounts of income flow from citizens working abroad who send money back to their families. These payments are known as remittances in the national accounts.
Why GNI is preferred over GDP:
GNI provides a better indicator of residents' incomes because it includes net income flows between countries. This makes it particularly valuable for countries with significant populations working abroad, as their earnings sent home (remittances) contribute to the nation's income even though these earnings weren't generated within the country's borders.
Advantages of GNI
GNI has several strengths that make it a valuable economic indicator:
-
Clear and standardised: The measure has a clear, internationally recognised definition that makes it straightforward to understand and apply consistently across different contexts.
-
International comparability: It uses an agreed international standard, allowing economists and policymakers to make meaningful comparisons between countries.
-
Wide availability: Data on GNI is available for almost every country in the world, making it a practical tool for global economic analysis.
-
Population adjustment: GNI can be adjusted to account for differently sized populations by calculating the average per person, making comparisons between large and small countries more meaningful.
Calculating GNI per capita
GNI per capita is the average level of GNI per head of population. This calculation is essential when comparing income levels across countries because nations have vastly different population sizes.
Worked Example: Comparing China and Malaysia (2020)
Suppose we want to compare living standards in China and Malaysia. In 2020:
- GNI in China was US$14,881.745 billion
- GNI in Malaysia was US$342.454 billion
At first glance, China appears much wealthier. However:
- China's population was 1,402 million
- Malaysia's population was 32 million
Step 1: Convert GNI from billions to millions for consistency with population units
- China: US$14,881,745 million
- Malaysia: US$342,454 million
Step 2: Calculate GNI per capita using the formula:
Step 3: Perform the calculations
- China:
- Malaysia:
Conclusion: On average, Malaysia's GNI per capita was slightly higher than China's, despite China having a much larger total GNI.
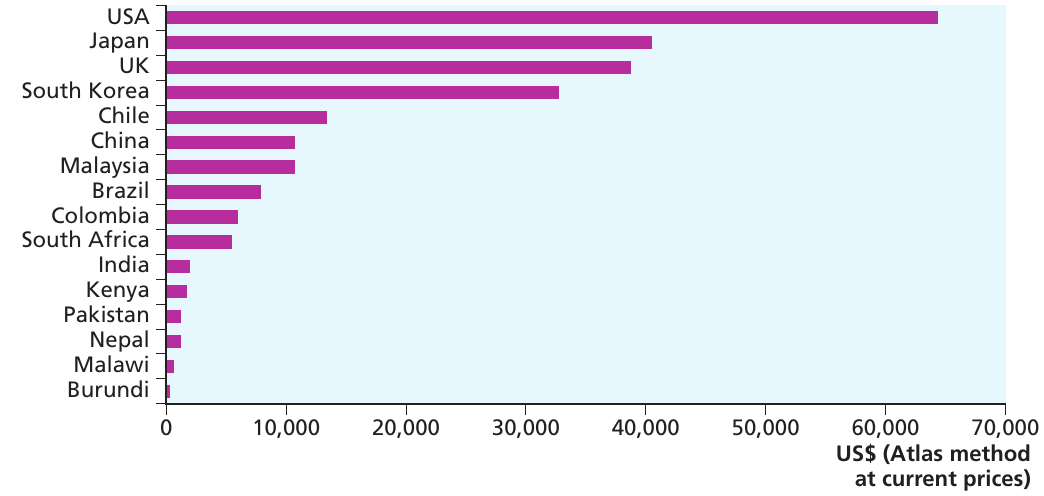
Figure 9.5 provides data on GNI per capita for a range of countries around the world. The extreme differences that exist globally are immediately apparent. GNI per capita in Burundi was just $270 in 2020, whereas in the USA the figure was $64,530.
Evaluating GNI per capita as a measure
Strengths of GNI per capita
When used appropriately, GNI per capita has several important strengths:
- It has a clear, universally understood definition
- It represents an internationally agreed standard
- Data is widely available for the vast majority of countries
- It accounts for differences in population size between countries
Weaknesses of GNI per capita
However, when interpreting international comparisons using GNI per capita, several important issues must be considered:
Income distribution: The measure does not account for inequality in the distribution of income within countries. Looking at average income per person can be misleading if income is distributed very unevenly. It cannot be assumed that every person in Burundi receives $270, or that every US citizen receives $64,530. If income is more unequally distributed in some countries, this affects what the term 'average' actually means.
For example, Brazil and Georgia had broadly similar GNI per capita levels in 2019, but the income distribution in Georgia was more equitable than in Brazil.
Data quality: The quality and accuracy of data collection may vary significantly across countries. Even when countries follow internationally agreed definitions of GNI, some data collection agencies may be more reliable than others. Definitions of GNI and other variables are set out in clear, internationally agreed formats, but implementation varies.
Exchange rate distortions: Measurements may be distorted by exchange rate effects. GNI per capita figures don't necessarily reflect the true standard of living experienced by residents.
Formal activity focus: The measure focuses only on formal economic activity and transactions that can be easily monitored and recorded.
Limited social indicators: It gives insufficient attention to health and education levels in society, which are crucial components of quality of life.
Environmental neglect: It does not account for the impact of environmental change or degradation on people's lives.
Well-being gap: It may not capture the overall well-being or happiness experienced by a nation's citizens.
Limitations of GNI as a measure
Inequality in income distribution
Average income figures can be misleading when there are wide differences in how income is distributed within countries. In other words, we cannot assume that every person living in Burundi receives $270 in income, or that every US citizen receives $64,530. When income is distributed more unequally in some countries, this affects our interpretation of what 'average' actually means.
Exam tip: It is important to consider per capita values of GNI when undertaking international comparisons because countries have different population sizes. This allows for meaningful comparison of living standards across nations.
The informal economy and data accuracy
A significant challenge with international comparisons is that data accuracy varies between countries. In every nation, some economic transactions go unrecorded. Economic activities that cannot be closely monitored because of their informal nature are especially prevalent in many developing countries, where substantial amounts of economic activity often take place without an exchange of money.
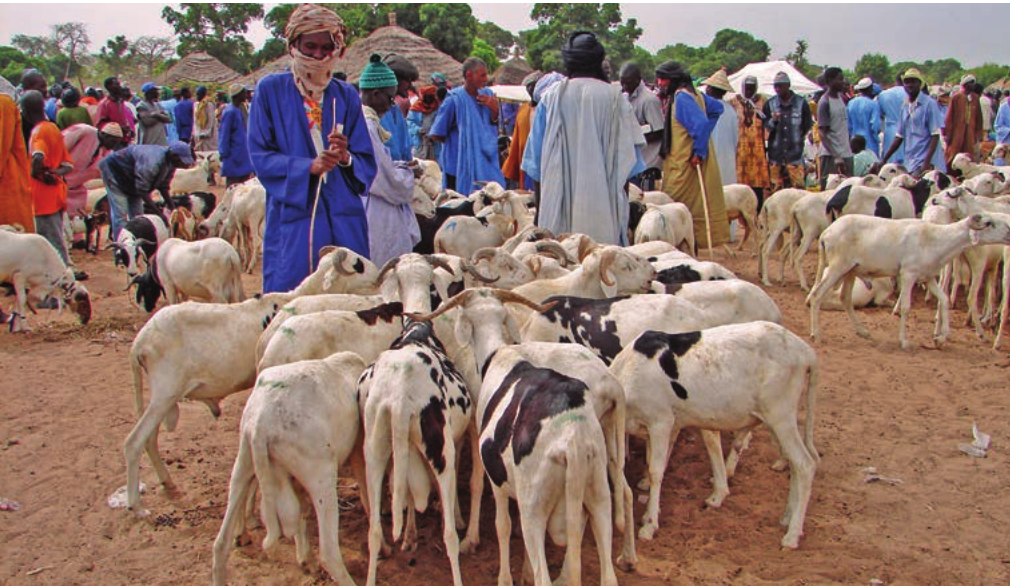
For example, subsistence agriculture remains an important component of economic life in many countries. If households produce food simply for their own consumption, there is no reason for a money transaction to take place regarding its production, and such activity will not be recorded as part of GNI. Similarly, much economic activity within urban areas of developing countries falls under the category of the informal economy.
Critical limitation: Where informal economic activity varies in importance between countries, comparing incomes based on measured GNI may be misleading. GNI will be a closer indicator of the true amount of real economic activity in some countries than in others. This means countries with large informal sectors may appear poorer than they actually are.
Exam tip: Be familiar with generalised facts about regions and countries of the world, but do not be expected to produce detailed facts and figures about individual countries in the exam.
Exchange rate problems
The GNI per capita data presented in Figure 9.5 were expressed in terms of US dollars. This allows economists to compare average incomes using a common unit of measurement. However, this approach may create some problems.
Economists want to compare average income levels so they can evaluate the standard of living and compare standards across countries. It is important to be able to assess people's command over resources in different societies, and to compare the purchasing power of income in different countries.
GNI is initially calculated in terms of local currencies, and subsequently converted into US dollars using official exchange rates. However, this may not provide accurate information about the relative local purchasing power of incomes.
Exchange rate distortions:
Official exchange rates may not accurately reflect purchasing power because:
- Government intervention: Many developing countries peg their exchange rates to international currencies (usually the US dollar), meaning rates reflect policy decisions rather than true purchasing power
- Trade-based pricing: Free-floating exchange rates are influenced strongly by prices of internationally traded goods, which differ significantly from goods typically consumed by local residents
These factors mean official exchange rates can misrepresent the relative purchasing power of incomes across countries.
Purchasing power parity (PPP)
The United Nations International Comparison Project (ICP) has been working on this problem for many years. It now produces an alternative set of international estimates of GNI based on purchasing power parity (PPP) exchange rates, which are designed to reflect the relative purchasing power of incomes in different societies more accurately, making comparisons between countries easier.
The method for producing these estimates relies on collecting prices for a common basket of items in different countries, covering a wide range of goods and services included in GDP. The cost of this bundle of goods in one country is then divided by the cost in another country to produce an exchange rate.
For example, to calculate the exchange rate between the UK and the USA, the formula would be:
This process reflects the relative purchasing power of the respective currencies.
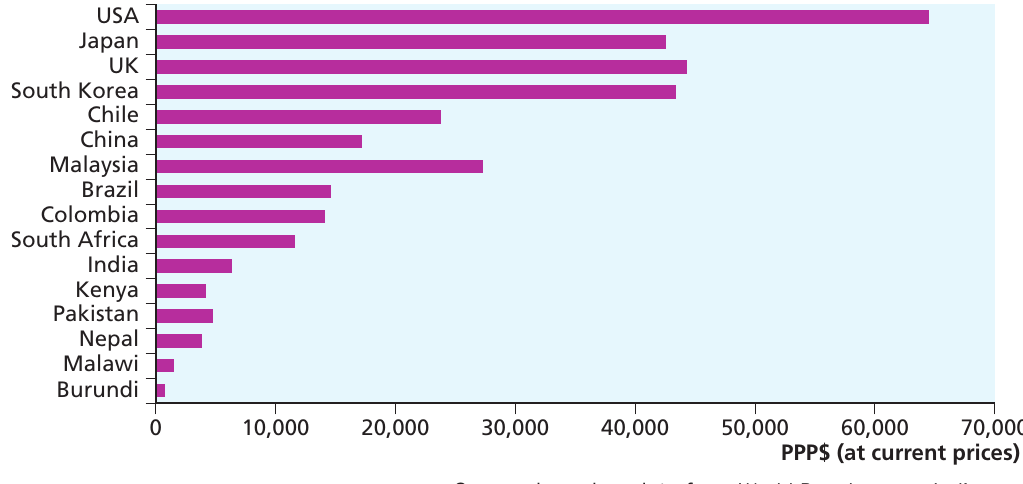
Figure 9.6 shows estimates for the same set of countries as in Figure 9.5, using the PPP exchange rates calculated by the ICP.
Comparing this with Figure 9.5, the gap between low-income and high-income countries appears somewhat less marked when PPP dollars are used as the unit of measurement, although it remains substantial. In other words, US dollar estimates exaggerate the gap in living standards between rich and poor countries. This is a general feature of these measurements — measurements in US dollars tend to understate real incomes for low-income countries and overstate them for high-income countries compared with PPP-dollar data.
Understanding PPP adjustments:
People in lower-income countries have a stronger command over goods and services than is suggested by US-dollar comparisons of GNI per capita. You can also observe that the relative levels of GNI per capita of countries in PPP dollars differ from those in US dollars in some cases — for example, compare Malaysia with Chile, or Japan with the UK.
Social indicators and quality of life
A fundamental question arises: can GNI be regarded as a reasonable indicator of a country's standard of living? GNI provides an indicator of the total resources available within an economy in a given period, calculated from data about total output, total incomes or total expenditure. However, this focus on summing up the transactions that take place in an economy over a period represents a rather narrow view of what constitutes the 'standard of living'. After all, it may be argued that the quality of people's lives depends on more than simply the material resources that are available.
Health and education
People need knowledge if they are to make good use of available resources. Two societies with similar income levels may nonetheless provide very different quality of life for their inhabitants, depending on the education levels of the population. Furthermore, if people are to benefit from consuming or using available resources, they need a reasonable lifespan coupled with good health. Good standards of health are crucial to a good quality of life.
It is important to remember that different societies tend to set different priorities regarding the pursuit of growth and the promotion of education and health. This needs to be taken into account when judging relative living standards through a comparison of GNI per capita. Some countries may have higher-than-average levels of health and education compared with other countries with similar levels of GNI per capita.
GNI per capita doesn't tell the whole story:
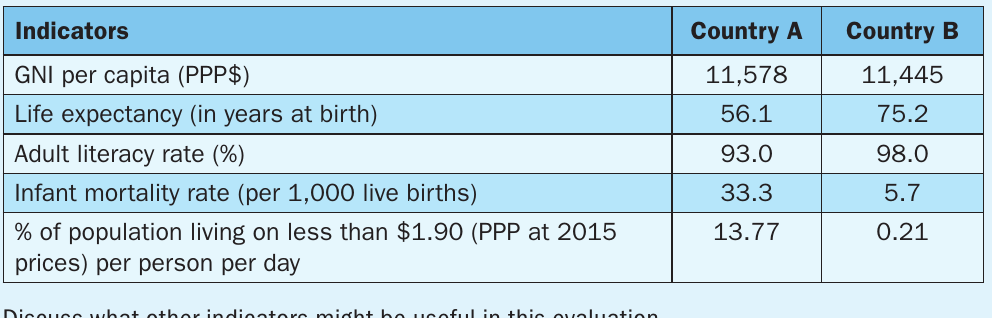
This table compares two countries with similar GNI per capita (measured in PPP$) but vastly different outcomes:
Country A vs Country B:
- Life expectancy: 56.1 vs 75.2 years
- Adult literacy: 93% vs 98%
- Infant mortality: 33.3 vs 5.7 per 1,000
- Extreme poverty: 13.77% vs 0.21%
This demonstrates that GNI per capita alone does not capture the true quality of life differences between nations. Social indicators reveal dramatic differences in living standards that income data misses.
Synoptic link: The United Nations produces an indicator known as the Human Development Index, which takes education and health levels into account as well as GNI per capita. This is discussed in Chapter 28.
Environmental factors
A reasonable environment in which to live may be seen as another important factor affecting quality of life, and there may be a trade-off between economic growth and environmental standards.
There are environmental issues that can distort the GNI measure of resources. Suppose there is an environmental disaster — perhaps an oil tanker breaks up close to a beautiful beach. This reduces the overall quality of life by degrading the landscape and preventing enjoyment of the beach. However, it does not have a negative effect on GNI; on the contrary, the money spent on clearing up the damage actually adds to GNI, so that the net effect of an environmental disaster may be to increase the measured level of GNI!
Exam tip: Be able to give examples of aspects of the standard of living that are not captured in the measurement of GNI, such as environmental quality, income distribution, and non-market activities.
Economic growth: international experience
In the decades following the Second World War, countries in different regions experienced contrasting economic growth rates. Countries in sub-Saharan Africa such as Burundi, Malawi and Kenya, together with Nepal and India in South Asia, had started with very low levels of GDP per capita, and they experienced relatively low growth between 1960 and 1990. However, China and some other East Asian economies (such as South Korea and Malaysia) took off during this period, achieving rapid growth partly through exporting to world markets. Japan also grew rapidly at this time, while the UK and the USA grew at a more sedate pace of between 2% and 3% per annum.
Since 1990, patterns of growth have changed somewhat.
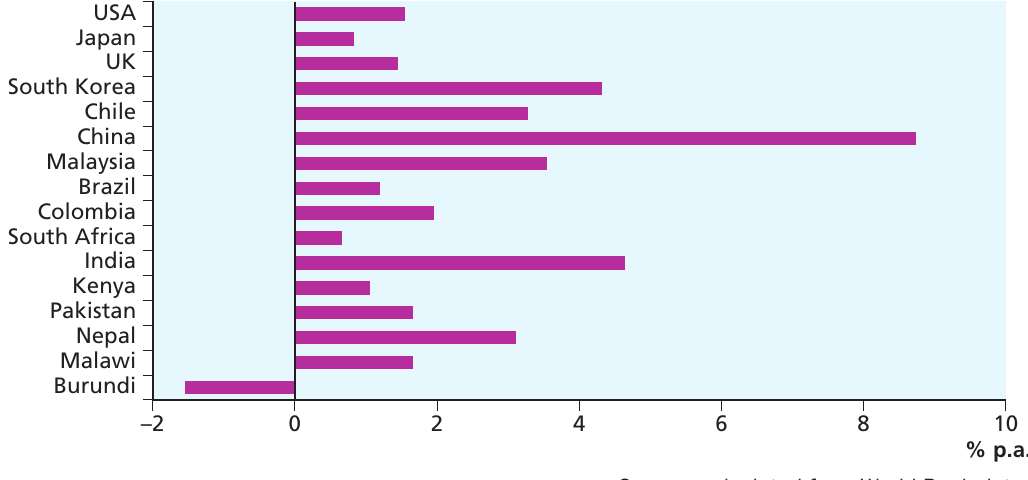
Figure 9.7 shows how growth in GDP per capita developed from 1990 to 2019 (on the eve of the COVID-19 pandemic).
China's exceptional performance (1990-2019):
The stand-out feature is the performance of China's economy, growing at an unprecedented rate of almost 10% per annum and making it a major player in the global economy. South Korea, India, Malaysia and Chile also showed strong growth in the period.
In contrast, some of the lower-income economies showed less positive results, with Burundi experiencing negative growth. Japan's economy slowed considerably over this period, while the UK and USA continued to grow at around 2% per annum.
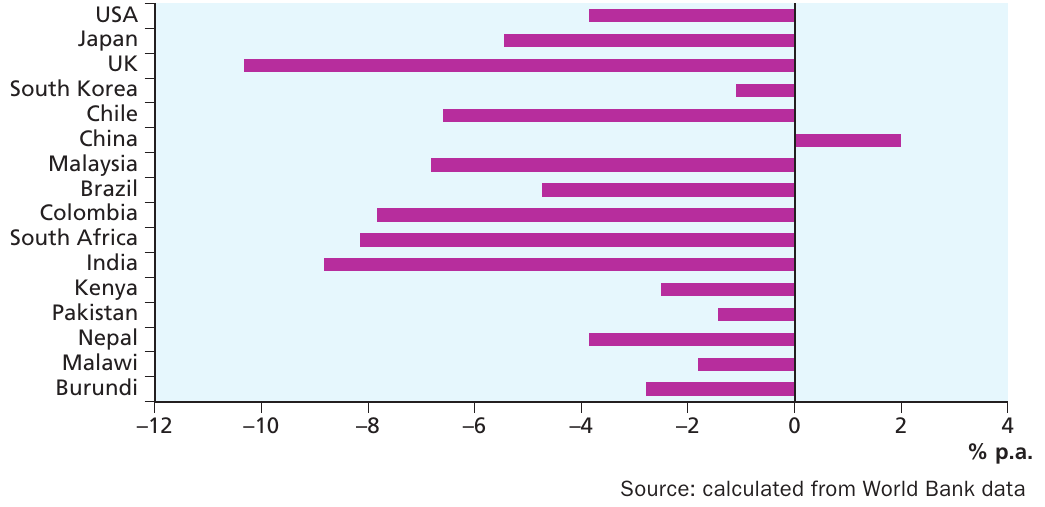
COVID-19 Impact (2019-2020):
Figure 9.8 shows the dramatic effect that the COVID-19 pandemic had on economic growth in its early stages. Between 2019 and 2020, only China in this selection of countries achieved positive growth.
In all other cases, GDP per capita fell as the pandemic hit. The UK suffered particularly severely, with GDP per capita falling by approximately 10%.
Can we measure happiness?
Gross national happiness and well-being
Jigme Singye Wangchuck, the king of Bhutan from 1972 to 2006, was intent on building an economy based on Buddhist values, so turned his back on the idea of GNI, shifting the focus of attention to GNH, gross national happiness. Can this be measured? One possibility is to ask people whether they are happy or not. The percentage of people answering positively could then be used as an indicator, and it would be possible to track how this changes through time, or across countries.
The 2007 OECD World Forum issued a declaration calling for fact-based information that could be used by a society to formulate a shared valuation of national well-being. In the UK, the ONS launched its Measuring National Well-Being Programme in 2010, to bring together a range of indicators of the quality of life, across ten dimensions, that would allow the monitoring of well-being through time. These indicators include measures of personal well-being, relationships, health, education and the environment, as well as some relating to the economy and personal finance. Again, these measures have not yet become fully embedded in the process of monitoring the economy, but they do allow some comparisons to be made across Europe, as similar measures are being produced for other countries.
Happiness and income
To what extent is happiness likely to be correlated with incomes? The relationship is not likely to be very close, as people's subjective perception of happiness will be related to a whole range of different things in addition to their material prosperity. Figure 9.9 uses data from the World Happiness Report of 2018 to produce a scatter plot of happiness against GNI per capita for 148 countries for which data were available. The values for happiness for each country represent the average values from interviews with individuals, based on a scale of 0 to 10.
The Easterlin paradox:
Easterlin paradox: the hypothesis that happiness increases with average incomes, but only up to a point.
Economist Richard Easterlin has argued that happiness increases with average incomes, but only up to a point. This means that beyond a certain income level, additional income doesn't necessarily lead to greater happiness.
An important argument in this discussion is that people in countries with the highest average incomes are not necessarily happier than those in lower-income societies. For example, compare Costa Rica with Qatar in Figure 9.9. Incomes are much higher in Qatar, but people seem to be happier in Costa Rica.
One factor that may help to explain this is that people's happiness may be influenced by their relative position in society. It may be that an individual with a decent (or even large) salary may feel that they are less well-off than their neighbours, which may cause discontent.
The scatter diagram from the World Happiness Report reveals several interesting patterns. At low levels of per capita income, there appears to be a positive relationship between income and happiness — happiness increases quite steeply as income rises. However, towards the right of the graph, the relationship flattens, suggesting that average incomes become less important in influencing happiness when income levels reach a certain point. This provides support for the Easterlin paradox.
Notice that the spread of data points is quite wide, suggesting that the relationship between the two variables is not particularly close. Some countries like Finland achieved very high happiness levels despite not having the highest average incomes. Burundi and the Central African Republic were among the lowest countries for both GNI per capita and happiness. In spite of its emphasis on gross national happiness, Bhutan is in the centre of the cluster of points. However, people surveyed in Costa Rica seem to be happier than would be expected from their per capita GNI levels.
Key Points to Remember:
-
GNI vs GDP: GNI provides a more accurate measure of living standards than GDP because it includes net income flows from abroad and reflects the resources actually available to a country's residents.
-
Per capita adjustment: GNI per capita is essential for international comparisons as it adjusts for different population sizes across countries.
-
Major limitations: GNI has significant limitations: it ignores income distribution within countries, doesn't capture the informal economy, focuses only on formal economic activity, and gives insufficient attention to health, education and environmental quality.
-
PPP advantage: Purchasing power parity (PPP) exchange rates provide a better basis for international comparison than official exchange rates because they reflect the actual purchasing power of incomes in different countries.
-
Beyond income: Social indicators such as health, education and environmental quality are important components of living standards that are not captured by GNI alone, and countries with similar GNI per capita can have very different quality of life outcomes.