Parametric Equations - Sketching Graphs (Edexcel A-Level Mathematics): Revision Notes
9.1.3 Parametric Equations - Sketching Graphs
Sketching graphs of parametric equations involves plotting points that are defined by two separate equations—one for and one for —both in terms of a third variable, usually denoted as . The process is different from sketching a graph using Cartesian coordinates directly, where is expressed as a function of .
1. Understanding Parametric Equations
Parametric equations define both and as functions of a parameter :
Here, is the parameter, and as it varies, the pair () traces out a curve in the -plane.
2. Steps to Sketching the Graph
a) Choose a Range for
- Determine an appropriate range for the parameter , based on the problem or context.
- Sometimes the problem specifies a range, but if not, start with a range that covers typical values (e.g., for trigonometric functions).
b) Calculate Corresponding and Values
- For several values of within the chosen range, calculate the corresponding values of and .
- Create a table of values if needed to help organize your points.
c) Plot the Points
- On a Cartesian coordinate system, plot the points () for each value of .
- Pay attention to the order of plotting as increases, since this will show the direction of the curve.
d) Draw the Curve
- Connect the plotted points smoothly, considering the nature of the functions involved (e.g., whether they are linear, quadratic, sinusoidal).
- Indicate the direction of increasing with an arrow on the curve.
e) Identify Key Features
- Identify and mark any important features such as intercepts, maxima, minima, or points where the curve changes direction.
- If applicable, find where the curve crosses the axes by setting or and solving for .
3. Example: Sketching a Circle
Example : Let's sketch the graph of the following parametric equations:
where ranges from 0 to 2π.
Step-by-Step Solution:
- Range of :
- ranges from to .
- Calculate and Values:
- For : , .
- For : .
- For : ) = , ) = .
- For : () ) = 0, .
- For : ) =, = .
- Plot the Points:
- Plot the points , , , , and back to on the Cartesian plane.
- Draw the Curve:
- Connect the points smoothly, forming a circle.
- Indicate the direction of increasing (counter clockwise in this case).
- Identify Key Features:
-
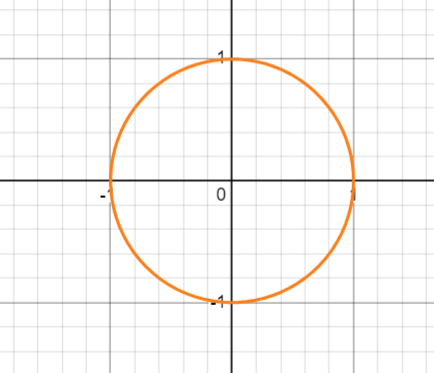
The curve is a circle with radius 1, centred at the origin . Graph:
-
The circle is traced counter clockwise as increases from to .
4. Example: Sketching an Ellipse
Example : Consider the parametric equations:
where ranges from 0 to 2π.
Step-by-Step Solution:
- Range of :
- ranges from to .
- Calculate and Values:
- For : , .
- For : ) = ) , ) =) .
- For : , .
- For : , .
- For : , .
- Plot the Points:
- Plot the points , , , , and back to .
- Draw the Curve:
- Connect the points smoothly, forming an ellipse.
- Indicate the direction of increasing (again, counter clockwise).
- Identify Key Features:
-
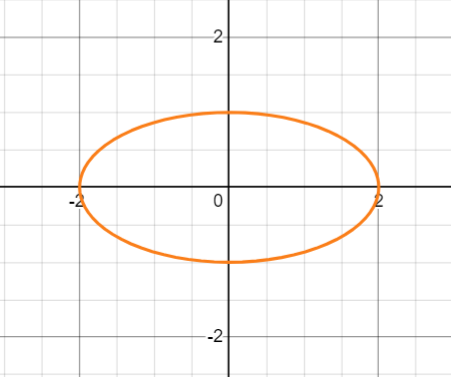
The ellipse is centred at the origin, with a horizontal axis of length 4 (from to ) and a vertical axis of length 2 (from to ). Graph:
-
The ellipse is wider along the -axis than the -axis.
Summary
- Parametric equations provide a flexible way to describe curves that might be difficult to express with a single Cartesian equation.
- Sketching parametric curves involves calculating specific points for given values of t, plotting them, and smoothly connecting them while indicating the direction of motion.
- Understanding the nature of the functions and is crucial for anticipating the shape of the curve and its behaviour as varies.