Harder Graphs (AQA GCSE Maths): Revision Notes
Harder graphs
Understanding different types of harder graphs is essential for GCSE mathematics. This revision note covers the main types of harder graphs you'll encounter, including their equations, key properties, and how to sketch them effectively.
Cubic graphs (x³ graphs)
Cubic graphs follow the general form , where any of the coefficients b, c, or d can be zero. These graphs are also known as polynomial functions and have some distinctive characteristics that make them recognisable.
The most important feature of cubic graphs is their characteristic shape - they always have a "wiggle" in the middle. This wiggle can be quite flat or more pronounced depending on the specific equation. The key thing to remember is that x³ must be the highest power in the equation, and you cannot have any fractional terms like 1/x.
When sketching cubic graphs, the direction they travel depends on the coefficient of x³. If the coefficient is positive (like +x³), the graph goes up from bottom left to top right. If it's negative (like -x³), the graph goes down from top left to bottom right.
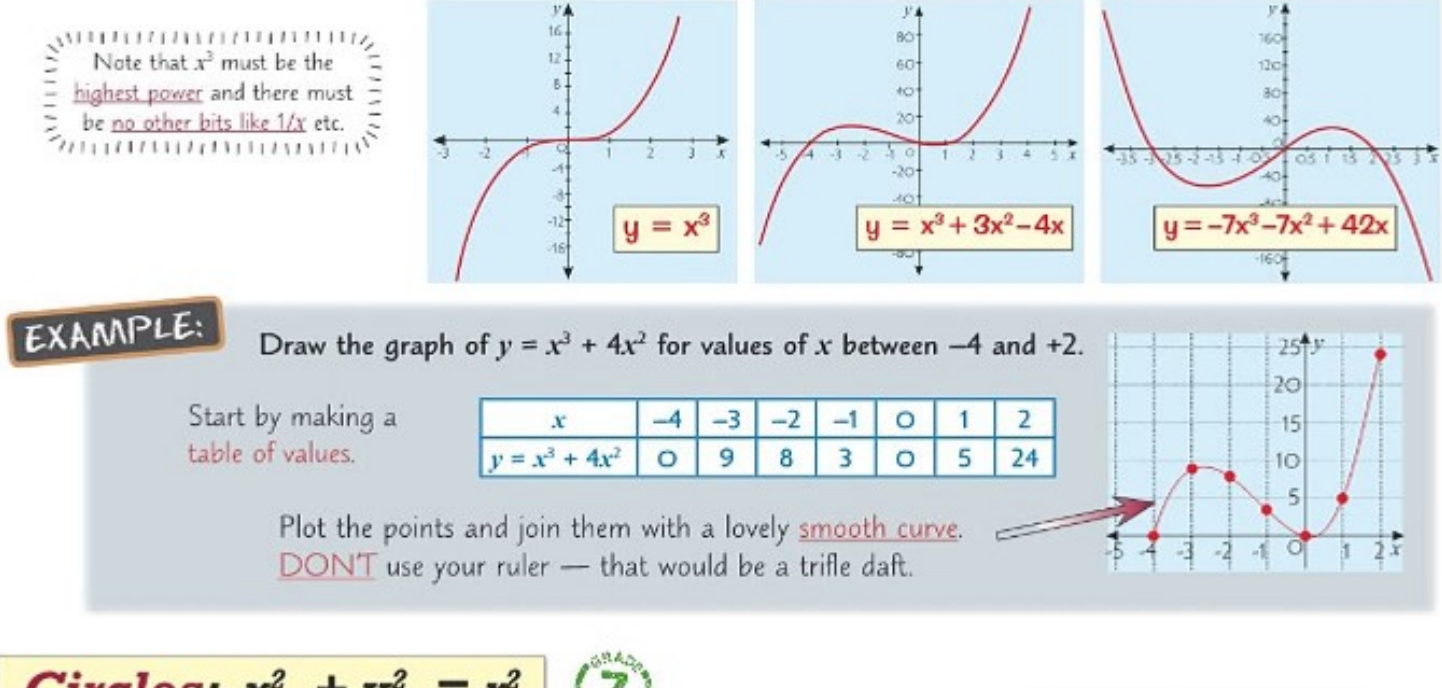
To draw a cubic graph accurately, you should always start by creating a table of values. Choose a range of x-values, substitute them into the equation, and calculate the corresponding y-values. Then plot these points on a coordinate grid and join them with a smooth curve.
It's crucial to use a smooth curve rather than straight lines when connecting points on cubic graphs - using a ruler would be inappropriate for this type of graph.
Circle equations and tangent lines
Circles centred at the origin follow a very specific equation format. When a circle has its centre at the point (0, 0) and radius r, its equation is . This is a fundamental relationship that you must memorise.
For example, the equation represents a circle with centre (0, 0) and radius 5, because , so . Similarly, represents a circle with centre (0, 0) and radius 10.
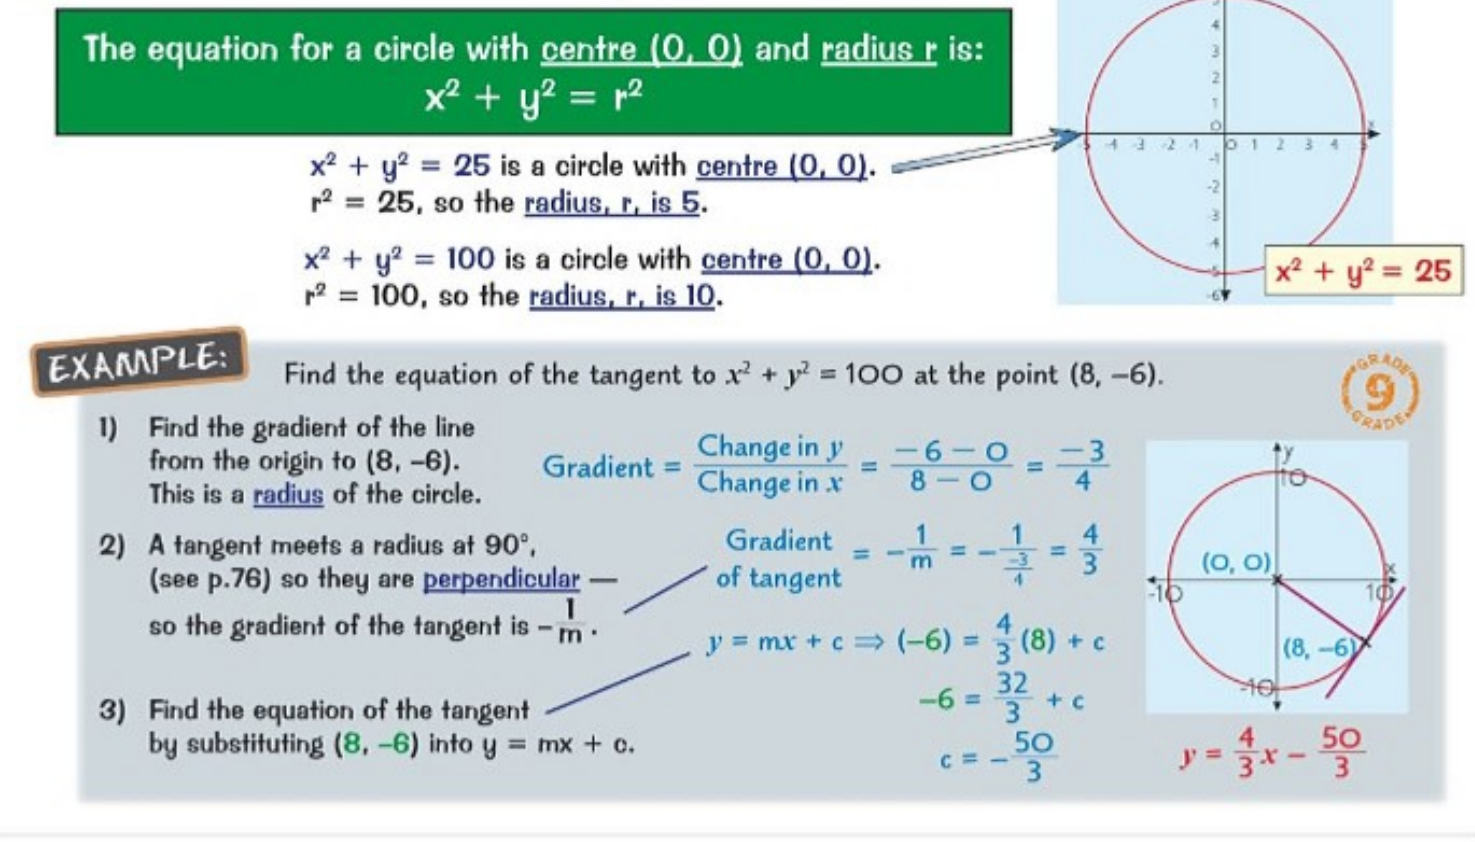
Finding the equation of a tangent line to a circle involves understanding the relationship between the radius and the tangent. A tangent line always meets the radius at 90°, meaning they are perpendicular to each other. This perpendicular relationship is the key to solving tangent problems.
Worked Example: Finding a Tangent Line Equation
Step 1: Find the gradient of the line from the centre to the point of tangency (this is the radius line)
Step 2: Calculate the perpendicular gradient for the tangent line
Step 3: Use this gradient with the point of tangency to find the complete equation of the tangent line
Exponential graphs (k^x graphs)
Exponential graphs come in two main forms: and , where k is a positive number. These graphs represent exponential growth and exponential decay respectively, and they have several important properties you need to understand.
All exponential graphs share certain characteristics: they are always positioned above the x-axis, and they always pass through the point (0, 1). This happens because any number raised to the power of 0 equals 1.
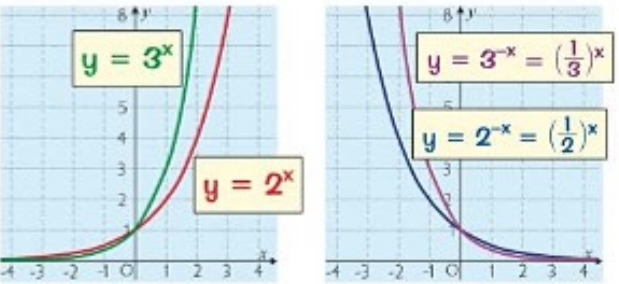 For exponential growth (when the power is positive), if k is greater than 1, the graph curves upwards as x increases. For exponential decay (when the power is negative), the graph is flipped horizontally and curves downwards as x increases, approaching the x-axis but never actually touching it.
These graphs are particularly useful for modelling real-world situations like population growth, radioactive decay, or compound interest. The key to working with exponential graphs is understanding how to substitute values and solve for unknown constants.
Reciprocal graphs (1/x graphs)
Reciprocal graphs follow the forms or , where A is a constant. These graphs create a distinctive hyperbola shape and have some unique properties that set them apart from other graph types.
The most important characteristic of reciprocal graphs is that they don't exist when x = 0, because division by zero is undefined. This creates a gap in the graph at the y-axis.
The graph consists of two separate curved sections that never actually touch each other.
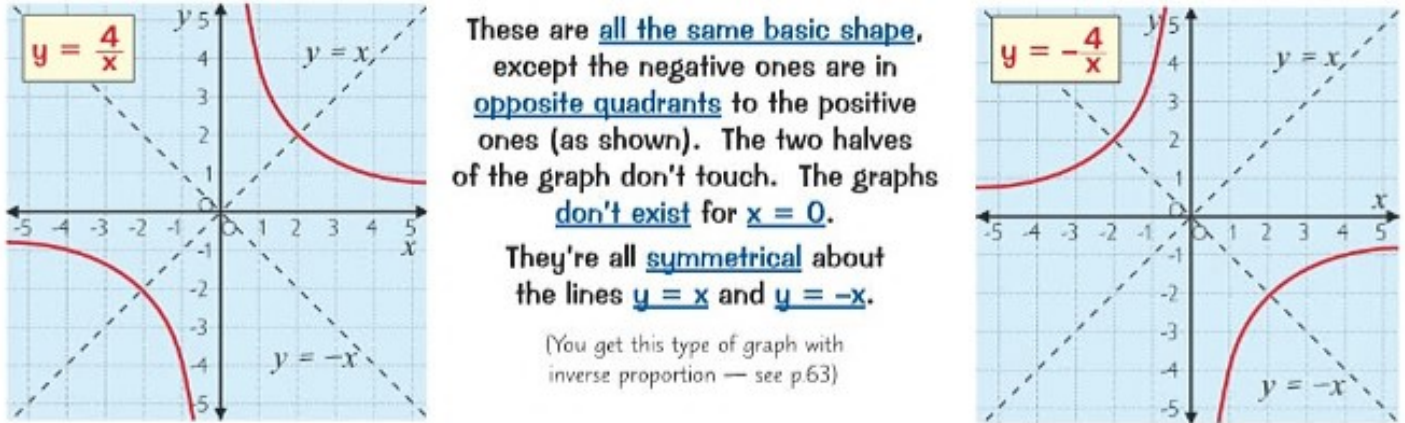 All reciprocal graphs with the same basic equation have the same fundamental shape, but their orientation depends on whether the constant A is positive or negative. Positive values create curves in the first and third quadrants, while negative values create curves in the second and fourth quadrants.
These graphs are symmetrical about the lines y = x and y = -x. The two halves of the hyperbola mirror each other across these diagonal lines. This symmetry is a useful property when sketching reciprocal graphs.
Trigonometric graphs
Trigonometric graphs include sine, cosine, and tangent functions, each with their own distinctive shapes and properties. Understanding these graphs is crucial for solving trigonometric problems and recognising periodic patterns.
Sine and cosine graphs have very similar underlying shapes - they both oscillate between upper and lower limits of exactly +1 and -1. The main difference is that the sine graph is shifted 90° to the right compared to the cosine graph. People often describe sine graphs as "waves" and cosine graphs as "buckets" because of their visual appearance.
Both sine and cosine functions repeat every 360°, making them periodic functions. When sketching extended versions of these graphs, you draw one complete cycle and then repeat it in both directions.
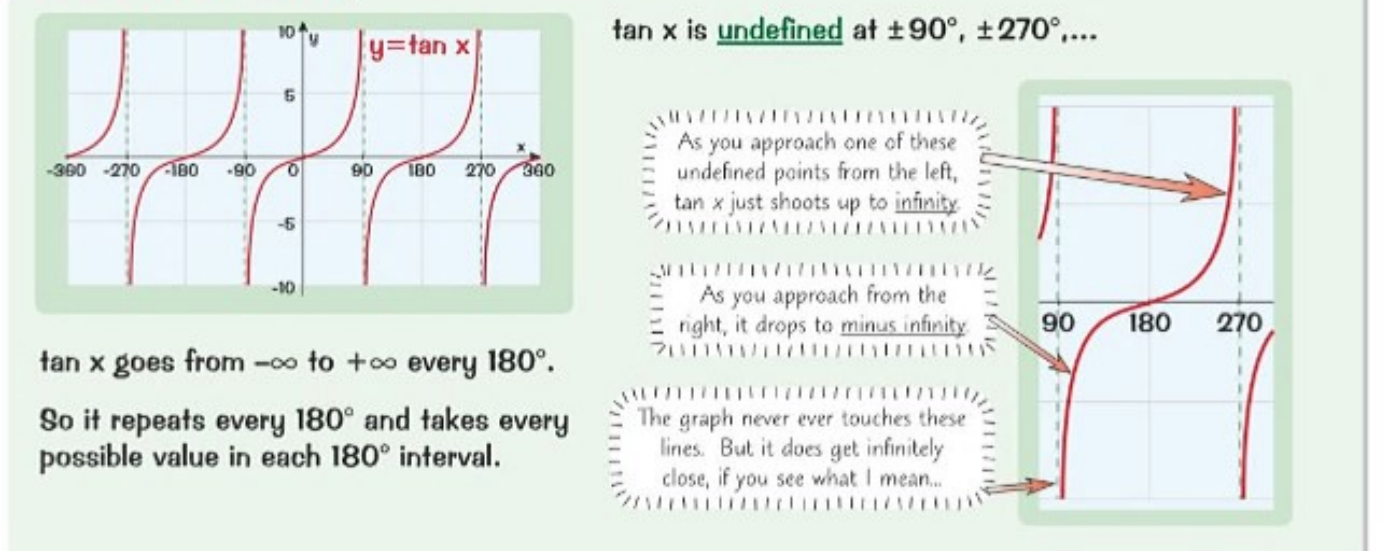 The tangent function is quite different from sine and cosine. Unlike the other trigonometric functions, tangent can take any value from negative infinity to positive infinity. It has a completely different shape, with vertical asymptotes (undefined points) at ±90°, ±270°, and so on.
Tangent repeats every 180°, which is half the period of sine and cosine. The graph consists of separate curved sections between each pair of asymptotes. When sketching tangent graphs, the easiest approach is to plot the key points that occur every 90° and then connect them with smooth curves.
Key Points to Remember:
- Cubic graphs always have a "wiggle" shape and require smooth curves when plotting - never use a ruler to connect the points
- Circle equations centred at the origin follow , and tangent lines are always perpendicular to the radius at the point of contact
- Exponential graphs are always above the x-axis and pass through (0, 1), with showing growth and showing decay
- Reciprocal graphs create hyperbola shapes, are undefined at x = 0, and are symmetrical about the lines y = x and y = -x
- Trigonometric graphs are periodic: sine and cosine repeat every 360° with ranges of ±1, while tangent repeats every 180° and can take any value