Solving Equations Using Graphs (AQA GCSE Maths): Revision Notes
Solving equations using graphs
When you need to solve equations that seem complicated or involve multiple variables, graphs can be your best friend! The key idea is simple: plot the equations as graphs and look for where they cross each other. These crossing points give you the solutions.
Finding solutions through intersection points
The fundamental principle behind graphical solutions is that when two graphs intersect, the coordinates of those intersection points satisfy both equations simultaneously. This makes graphical methods particularly useful for solving simultaneous equations and other complex mathematical problems.
To solve equations graphically, you need to plot the equations you want to solve and identify where the resulting lines or curves meet. The solution lies precisely at these intersection points.
The beauty of graphical solutions is their visual nature - you can literally see where the mathematical relationships meet, making abstract concepts more concrete and understandable.
Solving simultaneous equations
When working with simultaneous equations, you'll need to draw both graphs on the same coordinate system and carefully identify their intersection points.
 Here's the step-by-step process:
Worked Example: Solving Simultaneous Equations Graphically
Consider solving the system: and
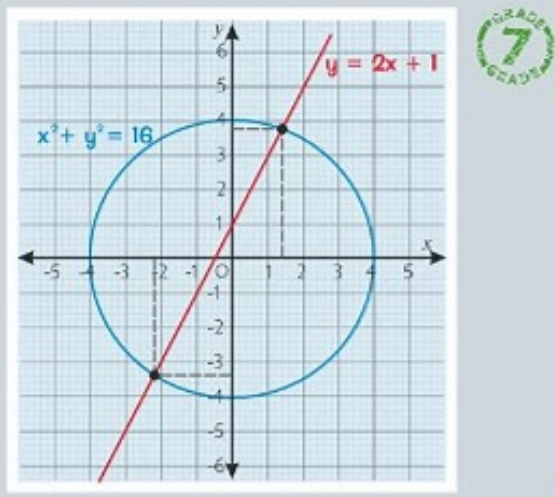
Step 1: Draw both graphs accurately Start by plotting each equation separately. The equation represents a circle centred at the origin with radius 4. The linear equation will give you a straight line. Use appropriate tools like compasses for circles to ensure accuracy.
Step 2: Look for intersection points Once both graphs are plotted, examine where they cross each other. A straight line crossing a circle will typically intersect at two points. Read the x and y coordinates of these intersection points carefully from your graph.
Step 3: Record your solutions Write down the coordinates of each intersection point. These represent the solutions to your simultaneous equations. Remember to express your answers to an appropriate degree of precision, typically to 1 decimal place unless specified otherwise.
Using graphs to solve more complex equations
Sometimes you'll encounter equations that don't naturally lend themselves to direct graphical representation. In these cases, you can use clever techniques to work with graphs you already have.
Trigonometric equations
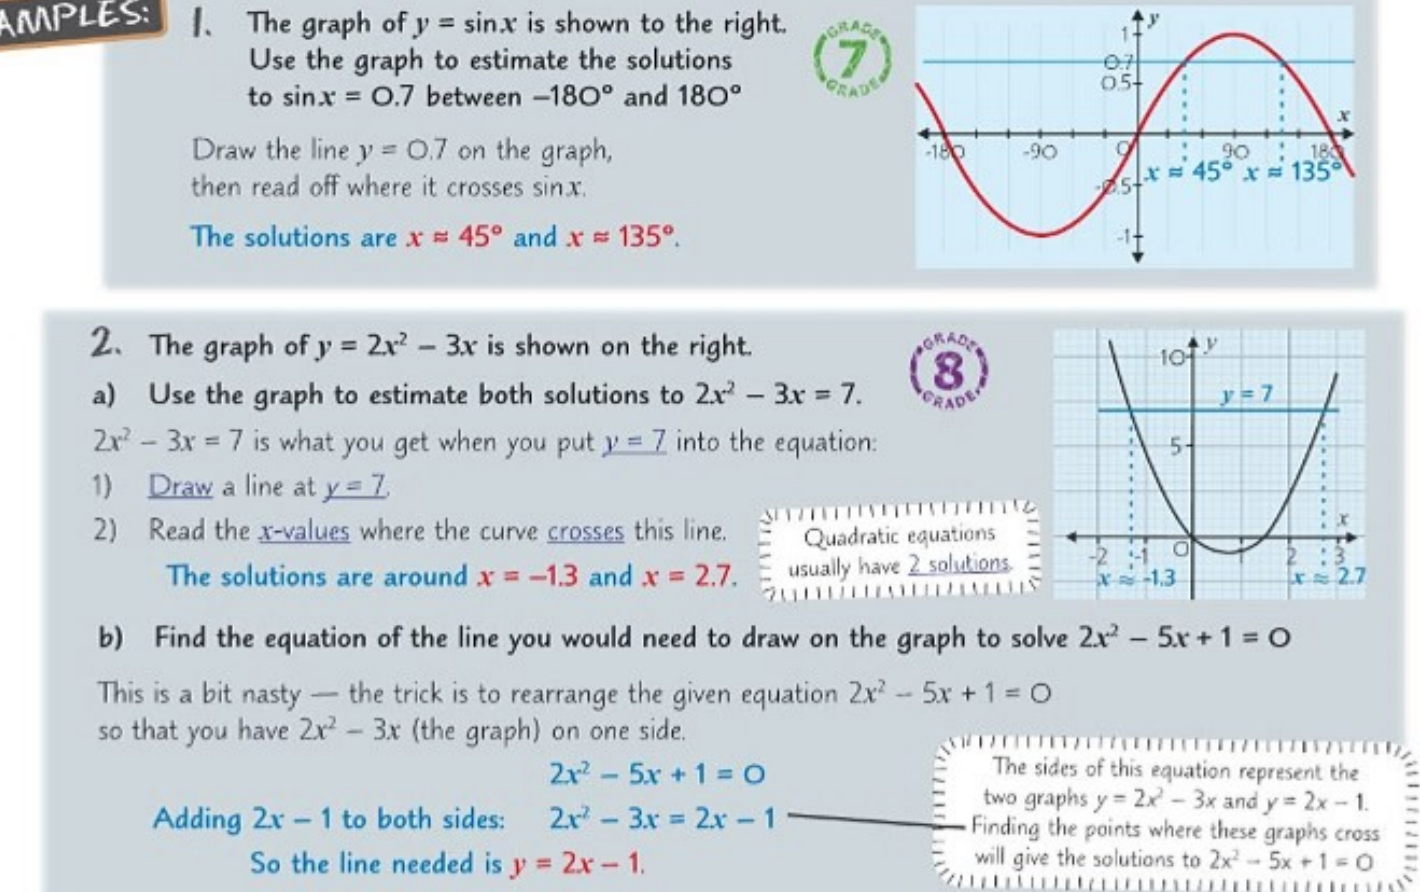
When solving trigonometric equations like , you can use the graph of and draw a horizontal line at . The points where this horizontal line crosses the sine curve give you the solutions.
For equations within a specific range (such as between -180° and 180°), make sure to only consider intersection points within that interval. The solutions will be the x-coordinates where the horizontal line meets the sine curve.
Always check that your solutions fall within the specified range. Trigonometric functions are periodic, so there may be many solutions outside your required interval that should be ignored.
Quadratic equations
Quadratic equations can be solved using similar principles. If you have an equation like , you can use two different approaches:
Method 1: Direct horizontal line Plot the graph of and draw a horizontal line at . The intersection points give you the solutions.
Method 2: Rearrangement technique For equations like , you can rearrange them cleverly. Since you already have the graph of , you can rearrange your equation:
- Start with:
- Rearrange to:
- This means you need to find where intersects with
This technique allows you to solve new equations using graphs you've already drawn, saving time and effort.
Tips for accurate graphical solutions
Working with graphs requires precision and careful observation. Here are some strategies to improve your accuracy:
Essential Tips for Accuracy:
- Use graph paper and plot points carefully
- Check your scale and ensure it's appropriate for the range of values
- When reading intersection points, estimate to the nearest appropriate decimal place
- Double-check your solutions by substituting back into the original equations
- Remember that some equations may have multiple solutions, so look for all intersection points
Common applications
Graphical methods are particularly useful for:
- Solving simultaneous equations involving circles and lines
- Finding solutions to trigonometric equations within specific ranges
- Solving quadratic equations, especially when factoring is difficult
- Estimating solutions when exact algebraic methods become complex
The beauty of graphical solutions lies in their visual nature - you can literally see the answers where the graphs meet, making abstract mathematical concepts more concrete and understandable.
Key Points to Remember:
- Solutions are intersection points - wherever two graphs cross, you'll find the solutions to your equations
- Accuracy matters - take time to plot graphs carefully and read coordinates precisely
- Use horizontal lines - for equations like or , draw horizontal lines to find intersections
- Rearrange cleverly - you can often rearrange equations to use graphs you've already drawn
- Check all intersections - make sure you identify all crossing points, as equations can have multiple solutions