Velocity-Time Graphs (AQA GCSE Maths): Revision Notes
Velocity-time graphs
What are velocity-time graphs?
Velocity-time graphs show how the velocity of an object changes over time. In these graphs, velocity is plotted on the y-axis and time on the x-axis. It's important to remember that velocity is speed measured in a particular direction, so when we're working with these graphs, we're mainly focusing on the speed aspect.
These graphs are essential for understanding motion because they provide a visual representation of how fast an object is moving and whether it's speeding up, slowing down, or maintaining constant speed.
Key principles of velocity-time graphs
There are four fundamental rules that will help you interpret any velocity-time graph. Understanding these principles is crucial for analysing motion effectively:
1. The gradient equals acceleration
At any point on a velocity-time graph, the steepness (gradient) of the line tells you the acceleration of the object. A steeper positive gradient means greater acceleration.
2. A negative slope means deceleration
When the line slopes downwards from left to right, this indicates the object is slowing down or decelerating.
3. Flat sections show steady velocity
Any horizontal line on the graph represents constant velocity - the object is moving at a steady speed without accelerating or decelerating.
4. The area under the graph equals distance travelled
This is one of the most important concepts. The total area underneath the velocity-time graph gives you the total distance the object has travelled during that time period.
Units and measurements
When working with velocity-time graphs, you need to understand the units involved. If velocity is measured in metres per second (m/s) and time in seconds (s), then acceleration will be measured in metres per second squared (m/s²). This unit tells us how much the velocity changes each second.
Understanding Units
The unit m/s² literally means "metres per second, per second" - it describes how many metres per second the velocity increases (or decreases) every second.
Finding the area under straight-line graphs
When a velocity-time graph consists of straight lines, finding the area underneath is straightforward. You can split the area into familiar shapes like triangles, rectangles, and trapeziums, then use standard area formulas to calculate each section.
This method works because each geometric shape has a well-defined area formula that can be applied directly to calculate the distance travelled.
Geometric Shapes for Area Calculation
- Rectangle: Area = length × width
- Triangle: Area = ½ × base × height
- Trapezium: Area = ½ × (sum of parallel sides) × height
Estimating area under curved graphs
Real-world motion often produces curved velocity-time graphs, which makes calculating the exact area more challenging. However, we can estimate the area effectively by dividing it into trapeziums of equal width.
The process involves a systematic approach that provides accurate approximations for complex curved motion:
- Dividing the area under the curved graph into several trapeziums of equal width
- Calculating the area of each trapezium using the formula: area = average of parallel sides × distance between them
- Adding all the trapezium areas together to get the total distance
Worked Example: Area Under a Curved Graph
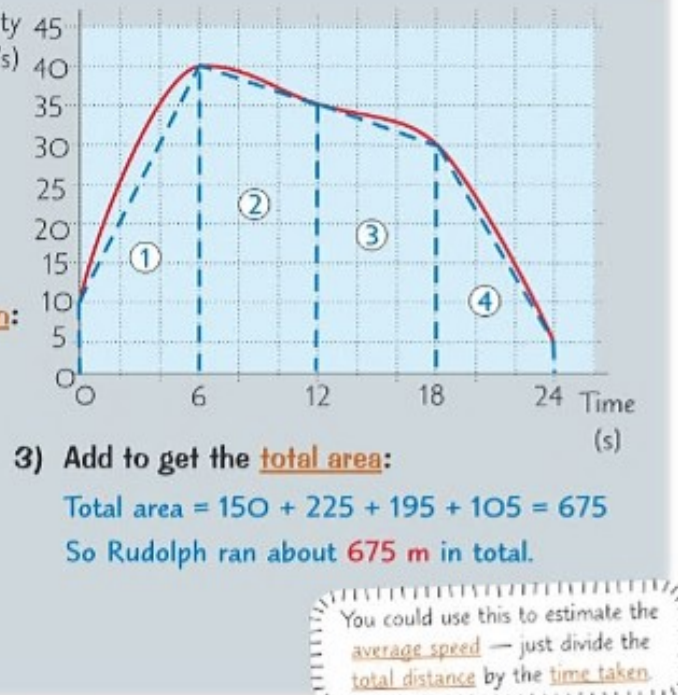
In the example shown, the curved graph has been divided into four sections. Each trapezium's area is calculated separately:
Step 1: Calculate each trapezium area
- Section 1: 150 units
- Section 2: 225 units
- Section 3: 195 units
- Section 4: 105 units
Step 2: Add all areas together Total area = 150 + 225 + 195 + 105 = 675 units
Step 3: Interpret the result The total distance travelled was approximately 675 metres.
Finding acceleration from velocity-time graphs
You can determine acceleration in two ways, depending on what type of analysis you need to perform:
For average acceleration: Calculate the gradient between two points on the graph by finding the change in velocity divided by the change in time.
For acceleration at a specific moment: Draw a tangent line to the curve at that point and find the gradient of this tangent line.
Calculating Gradient
Remember that gradient =
This gives you the acceleration in m/s².
Important reminders
Avoid Common Mistakes
When working with velocity-time graphs, be careful not to confuse them with distance-time graphs. The axes are different, and the interpretations change accordingly. Always check what each axis represents before starting your analysis.
Key Difference: In distance-time graphs, the gradient gives you velocity, but in velocity-time graphs, the gradient gives you acceleration.
The area calculation method is particularly useful for estimating average speed over a journey - simply divide the total distance (area under the curve) by the total time taken.
Key Points to Remember:
- Gradient = acceleration - the steeper the line, the greater the acceleration
- Negative slope = deceleration - downward sloping lines show the object is slowing down
- Flat sections = constant velocity - horizontal lines mean steady speed
- Area under graph = distance travelled - this works for any velocity-time graph
- Use trapeziums for curved graphs - divide the area into equal-width sections for better estimates