Frequency density (AQA GCSE Statistics): Revision Notes
Frequency density
What is frequency density?
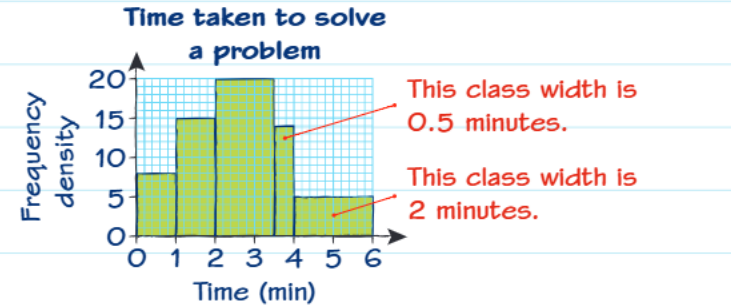
When working with histograms that have unequal class widths, we cannot simply use frequency on the vertical axis. Instead, we must use frequency density. This is because the area of each bar in a histogram represents the actual frequency (number of data points), not the height.
In histograms with unequal class widths, different bars have different widths, so we need to adjust the height to ensure the area still represents the correct frequency.
The key insight here is that area = height × width. In a histogram, we want the area to represent frequency, so when widths vary, we must adjust the height accordingly to maintain this relationship.
The golden rule
The Fundamental Formula
This golden rule ensures that when you multiply the frequency density (height) by the class width, you get back to the original frequency, which is represented by the area of the bar.
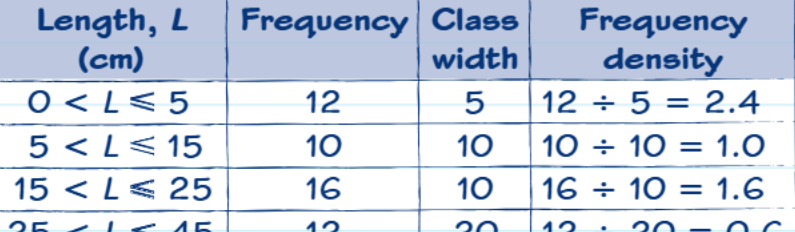
Understanding class widths
Class width is calculated by subtracting the lower boundary from the upper boundary of each class interval. For example:
- For the interval , the class width =
- For the interval , the class width =
Different class intervals can have completely different widths, which is why we need frequency density.
Why Class Widths Matter
When class widths are unequal, using regular frequency on the y-axis would make wider classes appear artificially more important simply because their bars would be wider. Frequency density corrects for this by adjusting the height based on the width.
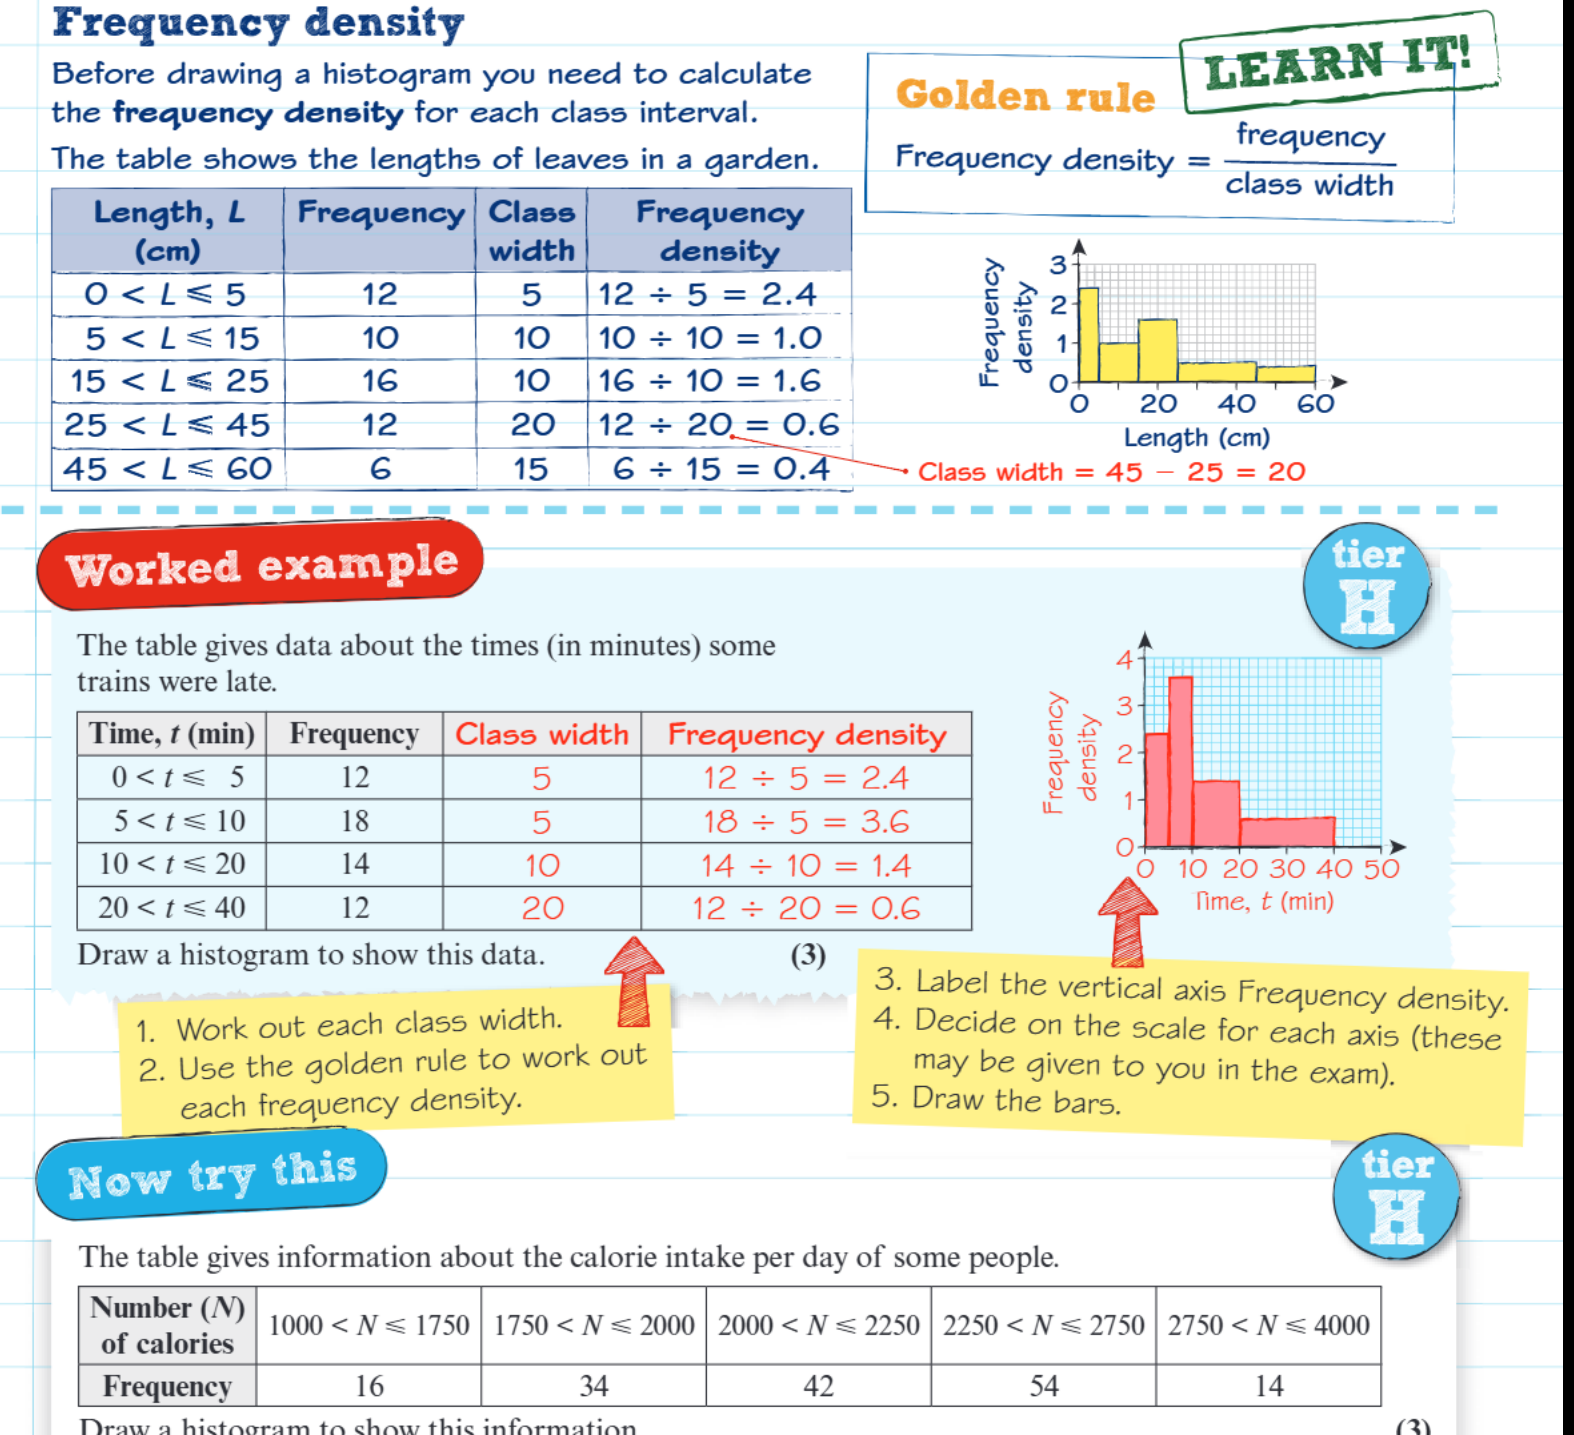
Worked example: Train delay times
Worked Example: Calculating Frequency Density for Train Delays
Let's work through a complete example using train delay data:
Step 1: Work out each class width
- : class width = minutes
- : class width = minutes
- : class width = minutes
- : class width = minutes
Step 2: Use the golden rule to calculate frequency density
- : frequency density =
- : frequency density =
- : frequency density =
- : frequency density =
Step 3: Label the vertical axis "Frequency density"
Step 4: Decide on the scale for each axis These scales may be provided in the exam, but you need to choose appropriate values if not given.
Step 5: Draw the bars Each bar's height corresponds to its frequency density value, and the width corresponds to the class width.
Key points for success
Key Points to Remember:
- The area of each bar represents the frequency, not the height
- You must calculate frequency density for every class interval before drawing
- Different class widths are perfectly normal - this is why the technique exists
- Always label your vertical axis as "Frequency density"
- Double-check your class width calculations, as this is a common source of errors
Common exam traps
Watch Out For These Common Mistakes:
- Forgetting to calculate class widths properly - always subtract the lower boundary from the upper boundary
- Using frequency instead of frequency density on the y-axis - this will result in incorrect bar heights
- Misreading inequality symbols - pay careful attention to whether boundaries are included () or excluded ()
- Calculation errors - always check your arithmetic when dividing frequency by class width
Remember!
Essential Points to Remember:
- Frequency density = frequency ÷ class width (the golden rule)
- Use frequency density when class widths are unequal
- The area of each bar represents the actual frequency
- Always label your vertical axis correctly as "Frequency density"
- Calculate all class widths first, then apply the golden rule to find frequency density