Angles for pie charts (AQA GCSE Statistics): Revision Notes
Angles for pie charts
Pie charts are brilliant visual tools for showing how data is divided into different categories. The key to creating accurate pie charts lies in understanding how to calculate the correct angles for each sector. Each sector's size must be proportional to the data it represents, and since a complete circle contains 360°, we need to work out what fraction of this total each category should take up.
The angle formula
When creating pie charts, you'll need to convert your data into angles that add up to exactly 360°. The essential formula you need to master is:
This formula works by finding what proportion each category represents of the total, then multiplying by 360° to find the corresponding angle in the pie chart.
Step-by-step method
Here's the systematic approach you should follow every time:
- Calculate the total first - Add up all the numbers in your data set
- Apply the formula - Use the angle formula for each category
- Check your work - All angles must add up to exactly 360°
- Draw accurately - Use proper equipment to construct your pie chart
Worked Example: Blood types
Let's work through a complete example using blood type data:
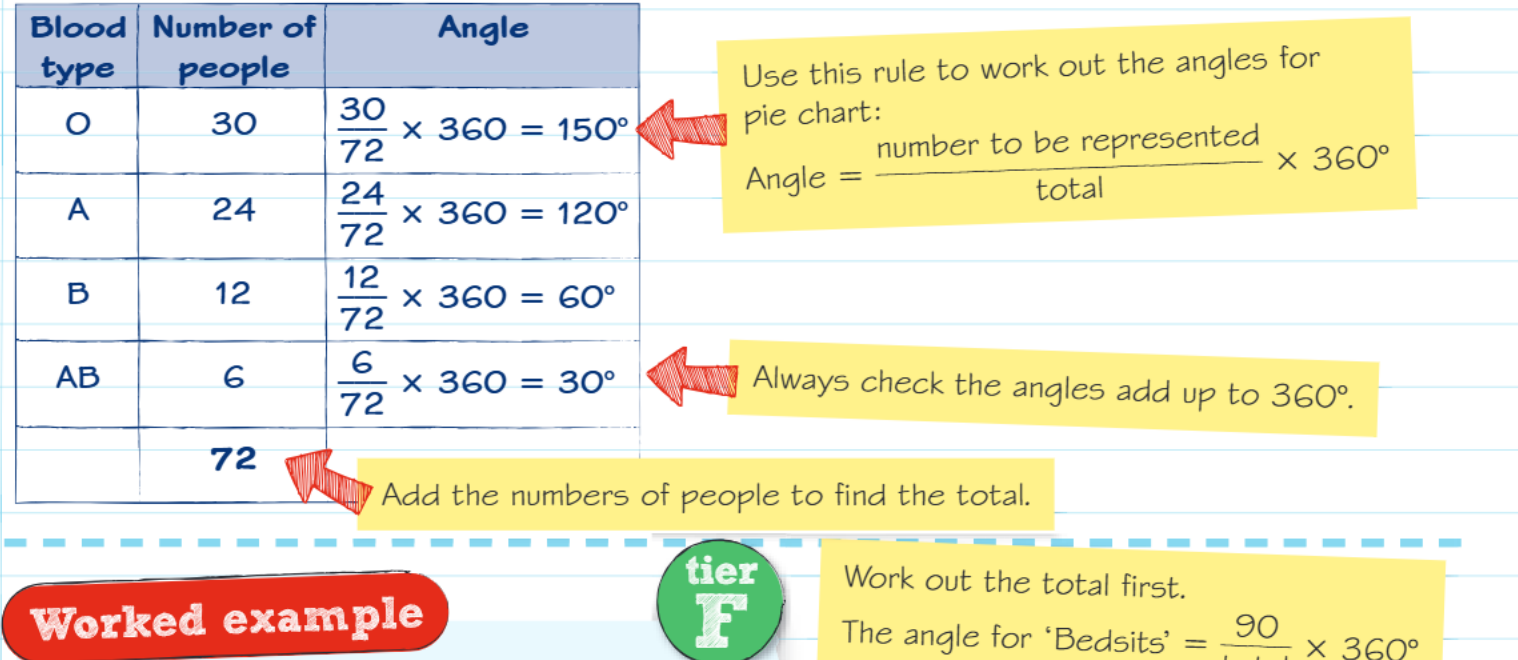
Data given:
- Type O: 30 people
- Type A: 24 people
- Type B: 12 people
- Type AB: 6 people
Step 1: Find the total Total = 30 + 24 + 12 + 6 = 72 people
Step 2: Calculate each angle
For Type O:
For Type A:
For Type B:
For Type AB:
Step 3: Check the total ✓
Worked Example: Types of flats
Here's another example to reinforce the method:
Data given:
- Bedsits: 90 flats
- 1-bedroom: 42 flats
- 2-bedroom: 30 flats
- 3-bedroom: 18 flats
Step 1: Find the total Total = 90 + 42 + 30 + 18 = 180 flats
Step 2: Calculate the angle for bedsits Angle for bedsits =
Notice that bedsits represent exactly half the total (90 out of 180), so they take up half the circle (180° out of 360°).
The remaining angles would be calculated using the same method for the other categories.
Essential equipment and tips
To draw accurate pie charts, you'll need:
- Compass for drawing the circle
- Protractor for measuring angles accurately
- Ruler for drawing straight lines to create sectors
Important exam tips:
- Always work out the total before calculating individual angles
- Double-check that all your angles add up to 360° - if they don't, you've made an error
- Remember to label each sector clearly
- Show all your working clearly in exams
- Round carefully - sometimes small rounding errors can cause totals that don't quite reach 360°
Common exam trap: Students often forget to find the total first, or they add up their angles incorrectly. Always take time to check your arithmetic.
Key Points to Remember:
- The pie chart angle formula is:
- Always calculate the total of all your data first
- All angles in a pie chart must add up to exactly 360°
- Use proper equipment (compass, protractor, ruler) for accurate construction
- Check your working by adding up all calculated angles - they should equal 360°