Calculating moving averages (AQA GCSE Statistics): Revision Notes
Calculating moving averages
What are moving averages and why do we use them?
When working with time series data, you'll often notice large variations with peaks and troughs that make it difficult to spot the underlying trend. This is where moving averages become incredibly useful.
A moving average is a statistical technique that smooths out data in a time series by creating a series of averages from different subsets of the complete dataset. Think of it as a way of ironing out the bumps in your data to reveal the hidden pattern underneath.

Moving averages are essential tools in data analysis because they help us see patterns that might be hidden by short-term fluctuations or seasonal changes.
The main benefits of using moving averages are:
- They help account for seasonal variation in the data
- They make it much easier to identify the overall trend
- They reduce the impact of random fluctuations
- They provide a clearer picture of what's really happening over time
Step-by-step method for calculating moving averages
The Core Method for 4-Point Moving Averages:
This systematic approach is fundamental to all moving average calculations and must be followed precisely.
Here's the systematic approach to calculating a 4-point moving average:
Step 1: Identify your first four consecutive values from your time series data.
Step 2: Add these four values together.
Step 3: Divide the sum by 4 to find the mean (this gives you your first moving average).
Step 4: Move along one position and repeat the process using the 2nd, 3rd, 4th, and 5th values.
Step 5: Continue this process for all possible groups of four consecutive values.
Critical Placement Rule: Always place each moving average result in the middle position of the values you used to calculate it. For a 4-point moving average, this means placing it between the 2nd and 3rd values.
Worked example 1: Fish catch data
Let's work through a complete example using quarterly fish catch data measured in thousands.
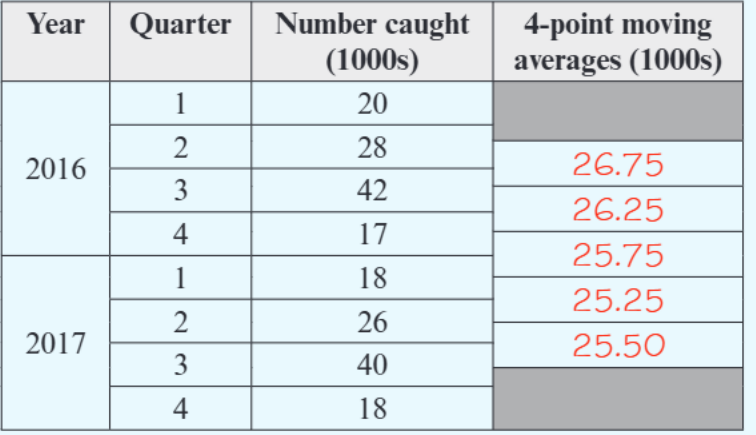
Worked Example: Fish Catch Moving Averages
Looking at this data, we can calculate the moving averages step by step:
First 4-point moving average: Using quarters 1-4 of 2016: (thousands)
This result goes between quarters 2 and 3 of 2016.
Second 4-point moving average: Using quarters 2-4 of 2016 and quarter 1 of 2017: (thousands)
This result goes between quarters 3 and 4 of 2016.
Third 4-point moving average: Using quarters 3-4 of 2016 and quarters 1-2 of 2017: (thousands)
Notice how the moving averages (26.75, 26.25, 25.75) show a clear downward trend, even though the original data jumps around significantly.
Worked example 2: Shoes sold data
Here's another example using shoe sales data to reinforce the method:
Worked Example: Shoe Sales Moving Averages
Starting with the values: 250, 306, 282, 244, 290, 320...
First 4-point moving average:
Second 4-point moving average:
Third 4-point moving average:
You can see how the moving averages (270.5, 280.5, 284) vary much less than the original figures and show a clearer upward trend.
Key rules and tips
Critical Rules for Moving Averages:
Number of points: The number of points in your moving average should cover one complete cycle of seasons. For quarterly data, use 4-point moving averages. For monthly data, you'd typically use 12-point moving averages.
Correct placement: This is crucial for exams! Always place your moving average result at the midpoint of the values you used to calculate it. For a 4-point average, it goes between the 2nd and 3rd values.
Additional Tips:
Incomplete calculations: Sometimes you won't be able to calculate all possible moving averages because there aren't enough data points at the beginning or end of your dataset. This is perfectly normal.
Trend identification: Once you've calculated several moving averages, look at whether they're increasing, decreasing, or staying roughly the same to identify the trend.
Common Exam Trap: Don't forget to divide by the correct number of points! It's easy to add up the values correctly but then forget the final division step.
Remember!
Key Points to Remember:
- Moving averages smooth out seasonal variations to reveal underlying trends in time series data
- For 4-point moving averages, add four consecutive values and divide by 4
- Always place each moving average at the midpoint of the values used to calculate it
- Moving averages vary much less than the original data values, making trends easier to spot
- The number of points should match one complete seasonal cycle (4 for quarterly data)