City inequalities (Edexcel GCSE Geography A): Revision Notes
City inequalities
Understanding economic change and deprivation
Cities across the UK have experienced significant economic transformations that have created stark inequalities within urban areas. These changes particularly affect how different neighbourhoods experience quality of life, with some areas thriving whilst others face multiple challenges. Understanding these patterns is crucial for recognising how economic restructuring impacts urban communities.
Understanding Deprivation
Deprivation serves as a key measure for understanding urban inequalities. It represents the extent to which people lack access to essential resources and opportunities that most of society takes for granted. This includes access to decent housing, employment opportunities, healthcare, education, and other services that contribute to a good quality of life.
When we study urban inequalities, deprivation helps us identify which areas are struggling most and why certain communities face greater challenges than others. This systematic approach allows policymakers and researchers to target interventions more effectively.
Birmingham case study: economic structure changes
Birmingham provides an excellent example of how economic restructuring has created urban inequalities. The city has undergone significant deindustrialisation over recent decades, fundamentally altering its economic landscape. This transformation occurred as traditional manufacturing industries declined and the city's economy shifted towards service-based activities.
The main drivers of economic change in Birmingham include the decline of manufacturing industry and insufficient investment in new economic opportunities. As factories closed and traditional jobs disappeared, many areas of the city were left without their primary source of employment.
The Ripple Effect of Economic Change
This economic transformation created a ripple effect throughout communities, as reduced employment opportunities led to lower incomes, reduced spending power, and declining local services. Understanding this interconnected impact is essential for comprehending urban inequality patterns.
Recent population increases have added further pressure to this changing economic structure. As more people move to the city seeking opportunities, competition for jobs and housing intensifies. This demographic shift has particularly affected certain areas, creating additional challenges for communities already struggling with economic transition.
The spatial pattern of deprivation across Birmingham reveals how these economic changes have affected different areas unequally. Some neighbourhoods have managed to adapt and prosper, whilst others have become concentrated pockets of disadvantage. This uneven development creates a patchwork of inequality across the urban landscape.
Measuring deprivation through SOAs
Super Output Areas (SOAs) provide a systematic way to measure and compare deprivation across small areas within cities. These geographical units are designed to contain populations of between 1,000 and 3,200 people, allowing for detailed analysis of local conditions. England contains 32,484 SOAs in total, each receiving scores for different aspects of deprivation including income, employment, health, education, housing, and access to services.
Precision in Measurement
This measurement system helps identify precise patterns of inequality within cities. Rather than making broad generalisations about entire urban areas, SOAs allow researchers and policymakers to pinpoint specific neighbourhoods facing particular challenges. This detailed approach is essential for understanding the complex geography of urban deprivation and targeting interventions effectively.
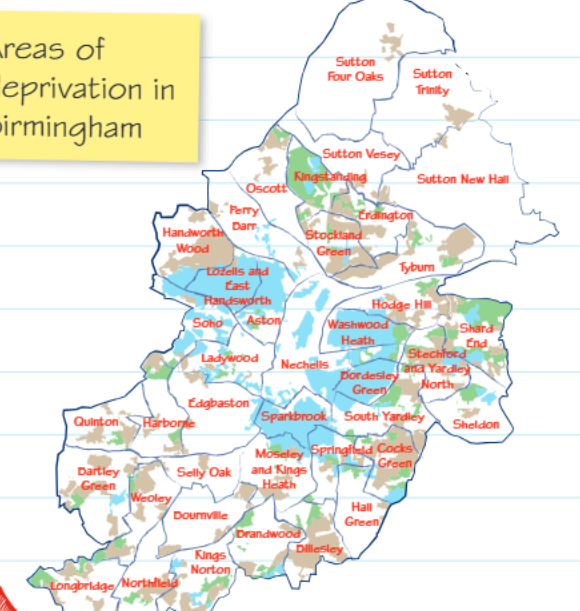
Birmingham's deprivation profile reveals significant contrasts across the city. Approximately 40% of Birmingham's population lives in areas ranked among the most deprived in England, highlighting the scale of inequality within the city. During the period 2004-2007, Birmingham was classified as the most deprived local authority in the West Midlands, demonstrating how economic restructuring has concentrated disadvantage in certain urban areas.
Stark Contrasts Within the Same City
However, deprivation in Birmingham is not uniformly distributed. Areas like Sutton Four Oaks rank within the top 5% of least deprived SOAs in the UK, showing that prosperity exists alongside poverty within the same city. This creates a stark contrast between different neighbourhoods, with some residents enjoying high-quality living conditions whilst others face multiple deprivations.
Quality of life variations across the city
The differences in quality of life across Birmingham reflect broader patterns of urban inequality. These variations stem from complex interactions between economic, social, and environmental factors that affect daily life for residents in different areas.
Population density plays a significant role in shaping quality of life experiences. Inner city areas typically experience higher population densities, which can strain local services and infrastructure. Healthcare services, schools, and transport networks may struggle to cope with demand, leading to longer waiting times, overcrowded facilities, and reduced service quality. This creates additional stress for residents and can contribute to poorer health and educational outcomes.
Housing Quality Variations
Housing provision varies dramatically across the city, reflecting both historical development patterns and contemporary investment decisions. Some areas benefit from high-quality housing stock and ongoing regeneration projects, whilst others contain older, poorly maintained properties that may lack modern amenities. The availability of different housing types also affects community composition, with some areas dominated by social housing whilst others consist mainly of owner-occupied properties.
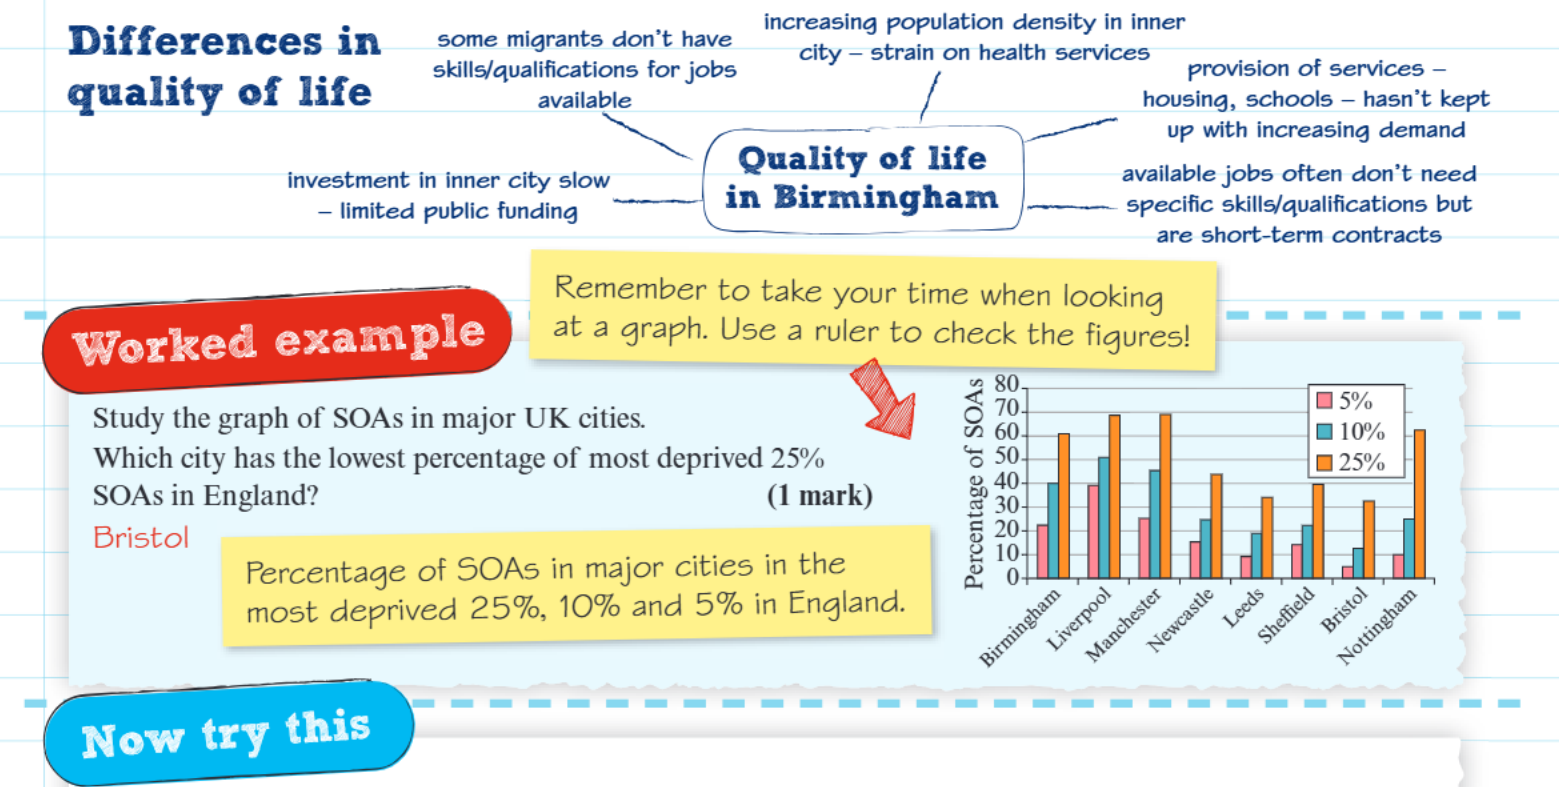
Employment opportunities are unevenly distributed across Birmingham, with some areas offering better access to jobs than others. However, a significant challenge exists in matching available employment with local skills and qualifications. Many residents lack the specific qualifications needed for available positions, whilst other jobs offer only short-term contracts that provide little security or career progression. This mismatch between skills and opportunities perpetuates economic disadvantage in certain communities.
Investment patterns significantly influence quality of life differences across the city. Inner city areas often receive limited public funding for infrastructure improvements, whilst other neighbourhoods benefit from substantial private and public investment. This uneven investment creates cumulative advantages for some areas whilst leaving others to decline further.
Migration Impact on Communities
Migration patterns also affect local quality of life, particularly when new residents arrive without the skills or qualifications needed for available employment. This can increase competition for basic services and housing whilst potentially reducing average income levels in receiving areas. However, migration can also bring new skills, cultural diversity, and entrepreneurship that benefit local communities.
Understanding deprivation data and patterns
When analysing urban inequalities, it's essential to understand how to interpret deprivation data effectively. Charts and maps showing deprivation levels use different categories to represent varying degrees of disadvantage. The most severely deprived areas (top 5% nationally) face the most acute challenges, whilst areas in the most deprived 10% or 25% experience significant but less extreme difficulties.
Interpreting Comparative Data
Comparing cities using this data reveals important patterns in urban inequality. Cities with higher percentages of areas in the most deprived categories typically face greater overall challenges in addressing urban problems. However, cities with lower percentages of highly deprived areas often still contain pockets of significant disadvantage that require targeted attention.
The spatial distribution of deprivation within cities follows recognisable patterns. Deprivation often concentrates in inner city areas, but can also affect suburban locations, particularly those dominated by social housing or areas that have experienced economic decline. Understanding these patterns helps explain why certain communities face persistent challenges despite broader urban prosperity.
Key Points to Remember:
-
Deprivation measures lack of access to essential resources and opportunities, helping identify areas facing the greatest challenges in cities like Birmingham
-
Economic restructuring through deindustrialisation has created uneven development patterns, with some areas prospering whilst others experience concentrated disadvantage
-
SOAs provide detailed measurement of local deprivation levels, allowing precise identification of inequality patterns within cities across different aspects of life
-
Quality of life varies significantly across urban areas due to differences in population density, housing quality, employment access, investment levels, and service provision
-
Birmingham demonstrates typical patterns of urban inequality, with 40% of residents living in highly deprived areas whilst other neighbourhoods rank among the least deprived nationally