Changing population (Edexcel GCSE Geography A): Revision Notes
Changing population
Understanding how populations change over time is crucial for studying global development. When examining developing or emerging countries, we need to look at both demographic changes (like population structure and life expectancy) and social factors that influence development patterns.
Population change analysis is fundamental to understanding development because it reveals how countries transition from high birth and death rates to lower, more stable rates - a process that directly impacts economic growth, social structures, and quality of life.

Population structure changes
Population structure refers to how a country's population is distributed across different age groups and genders. We can visualise this using population pyramids, which show the percentage of males and females in each age group.
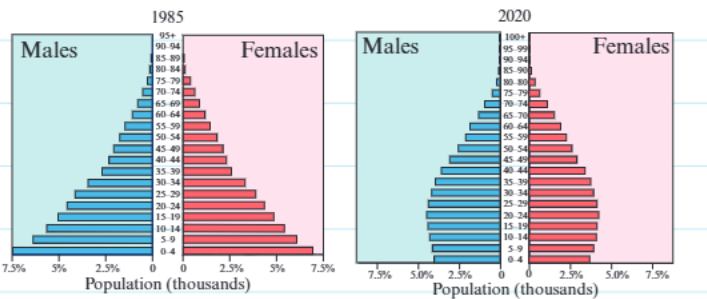
The population pyramids above demonstrate a significant demographic transition. In 1985, the pyramid had a classic triangular shape with a wide base, indicating high birth rates and a predominantly young population. By 2020, the structure had evolved into a more barrel-shaped distribution, showing lower birth rates and an ageing population.
Understanding Population Pyramid Shapes:
- Wide base (triangular): High birth rates, young population, typical of developing countries
- Barrel shape: Lower birth rates, ageing population, characteristic of developed countries
- Narrow base: Very low birth rates, potentially declining population
This transformation reveals several important demographic trends:
- A smaller proportion of people under 15 years old
- More economically active people aged 15-64
- An increasing number of people aged 65 and over
These changes indicate that the country has moved through demographic transition, with falling birth rates and improved life expectancy creating a more mature population structure.
Life expectancy improvements
Life expectancy represents the average age that men and women are expected to live to. This measure is a key indicator of development and quality of life in a country.
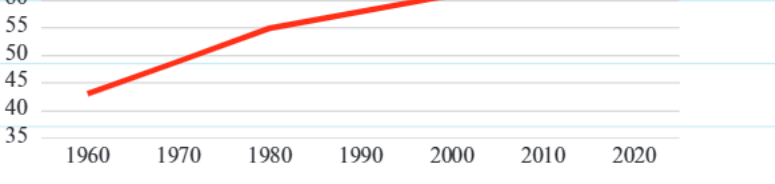
The graph shows remarkable improvement in life expectancy over recent decades. In India's case, life expectancy has increased substantially, rising from 54 years in 1985 to 70 years in 2020 - an improvement of 16 years over 35 years.
Key Factors Driving Life Expectancy Improvements:
- Reduced infant mortality rate: Fewer children are dying before reaching 5 years old due to better healthcare, nutrition, and disease prevention
- Reduced maternal mortality rate: Fewer mothers are dying during childbirth thanks to improved medical care and safer delivery practices
These factors are critical because they address the two main causes of premature death in developing countries.
This upward trend demonstrates how development initiatives focusing on healthcare and social services can have dramatic positive impacts on population health outcomes.
Social factors influencing development
As countries develop, various social changes occur that can both support and challenge further progress. These factors are interconnected and influence each other in complex ways.
Increased inequality
Development doesn't always benefit everyone equally. As economies grow, we often see:
- A wider gap developing between rich and poor populations
- Continuing low status for many women despite overall progress
- Older people sometimes not benefiting from economic improvements
Inequality can actually worsen during certain stages of development, creating social tensions that may slow or complicate the development process. This is why inclusive development policies are essential.
Growing middle class
Economic development typically leads to the expansion of a middle class, which brings:
- Increased urbanisation as people move to cities for better opportunities
- Greater access to education, creating more skilled workers
- Growing consumer markets that could become significant globally
- Higher demand for goods and services, stimulating further economic growth
Improved education
Investment in education is both a driver and result of development:
- Governments prioritise education spending as development progresses
- Literacy rates increase, creating a more skilled workforce
- Strong private education sectors often emerge alongside public systems
- Better education leads to improved health awareness and economic opportunities
Education creates a positive feedback loop in development: better education leads to higher incomes, which enable more investment in education, creating an upward spiral of improvement.
Case study application
Worked Example: Analysing India's Life Expectancy Trends
When studying population changes in developing countries, it's important to analyse specific data and trends.
Step 1: Examine the long-term data India's life expectancy from 1950-2020 shows dramatic improvement:
- 1950: 37 years
- 2020: 66 years
- Total increase: 29 years over 70 years
Step 2: Identify rate changes Comparing different periods:
- 1950-1980: Rapid improvements during early development
- 1980-2020: Continued improvement but at a slower rate
Step 3: Interpret the findings The slowing rate of improvement suggests that further gains may require different approaches or face new challenges, such as addressing non-communicable diseases or environmental health issues.
Key Points to Remember:
- Population pyramids: Wide base indicates young population, narrow base shows ageing population - this reflects the demographic transition process
- Life expectancy improvements: Result from better healthcare, reduced infant mortality, and improved maternal health services
- Social factors: Inequality, middle class growth, and education improvements are interconnected aspects of development that influence each other
- Development patterns: Vary between countries, making case study analysis essential for understanding specific contexts
- Evidence-based analysis: Data trends should always be supported with evidence and specific examples when explaining development patterns