Working with data (Edexcel GCSE Geography A): Revision Notes
Working with data
Understanding data presentation in rivers fieldwork
When conducting fieldwork investigations on rivers, you need to understand how to process and present your collected data effectively. This includes working with various formats such as maps, GIS systems, graphs, and diagrams - both hand-drawn and computer-generated versions.
Understanding different data presentation methods is crucial for fieldwork success. Each method has specific strengths and limitations that affect how effectively you can communicate your findings.
During your examination, you might encounter questions about how fieldwork data presentation could be enhanced. Rather than focusing on potential mistakes in data presentation, it's more valuable to consider the strengths and limitations of different presentation methods.
Common data presentation methods and their limitations
Understanding the drawbacks of different data presentation techniques helps you choose the most appropriate method for your fieldwork data and demonstrates critical thinking in your analysis.
Scattergraphs can only effectively show relationships between two variables, making them unsuitable when you need to display connections between three or more variables simultaneously.
Pie charts become problematic when dealing with numerous small segments, as these make the chart extremely difficult to read and interpret clearly.
Choropleth maps tend to conceal variations that exist within individual areas, creating an misleading impression of clear boundaries between regions rather than showing the gradual transitions that often occur in reality.
Triangular graphs require all data to be converted into percentages before plotting, which can be time-consuming and may not suit all types of data collection.
Bar graphs are limited because they cannot effectively display relationships between different categories of data - they only show individual values.
Cross-sectional diagrams provide only a snapshot of the river profile at one specific moment in time, failing to show how conditions change over different periods or seasons.
Worked example: Using scattergraphs effectively
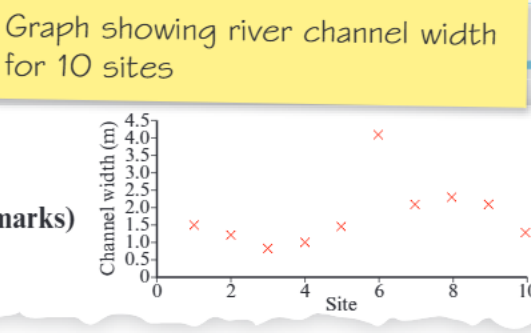
Worked Example: Investigating River Depth and Width Relationships
Consider a student investigating the relationship between river depth and river width. A scattergraph offers significant advantages for presenting this type of data.
Key benefit: The main benefit of using a scattergraph is its ability to help identify relationships between two variables. The visual format makes it straightforward to compare data points, and you can draw a line of best fit to indicate whether the relationship is positive, negative, or if no clear relationship exists between the variables.
Data interpretation: This scatter plot demonstrates how river channel width varies across different sites, showing a generally increasing trend from approximately 1.5 metres at early sites to over 4 metres at later sites.
The four-step process for analysing data
Successful data analysis in geography fieldwork follows a systematic approach that ensures thorough examination of your findings.
Step 1: Describe what you observe Begin by identifying the overall patterns and main features in your data. Look for any groupings in the figures and note any anomalies or exceptions that stand out from the general trend. This descriptive phase provides the foundation for deeper analysis.
Step 2: Use evidence from your data Support your observations with precise figures from your investigation. Include specific measurements, percentages, or other quantitative data that backs up the patterns you've identified. This evidence-based approach strengthens your analysis significantly.
Step 3: Provide reasons for observed patterns Explain why you think these patterns have occurred in your data. Consider the geographical processes, environmental factors, or human influences that might have caused the trends you've observed. This step demonstrates your understanding of underlying mechanisms.
Step 4: Link to geographical concepts and theories Connect your findings to the geographical concepts and theories you've studied in class. This shows how your fieldwork relates to broader geographical understanding and demonstrates your ability to apply theoretical knowledge to real-world situations.
Drawing conclusions and creating summaries
When concluding your fieldwork investigation, always return to your original research question or hypothesis. Use the evidence gathered during your investigation to provide a clear answer, supported by the data you've collected and analysed.
In examination situations, you may be asked to reflect on different aspects of your investigation through assessment or evaluation questions. Understanding the distinction between these is crucial for providing appropriate responses.
Assessment requires you to consider all relevant factors and identify the most significant ones. You're weighing up different elements to determine their relative importance in your investigation.
Evaluation involves making judgements about the value or success of something, then reaching a well-reasoned conclusion based on your analysis. This typically requires you to consider both strengths and weaknesses before making an overall judgement.
Practical application
When describing changes in data such as river channel width measurements, focus on identifying clear trends and patterns. For example, if examining channel width across multiple sites, note whether there's a consistent increase, decrease, or variation, and quantify these changes where possible using specific measurements from your data.
The key to successful data work in rivers fieldwork lies in combining accurate observation, evidence-based analysis, and clear connections to geographical theory. This systematic approach ensures your investigations meet the rigorous standards expected in geographical research.
Remember!
Key Points to Remember:
- Data presentation methods each have specific limitations - choose the most appropriate technique for your particular dataset and research question
- Follow the four-step analysis process: describe, use evidence, explain reasons, and link to geographical concepts
- Always return to your original hypothesis when drawing conclusions from fieldwork data
- Distinguish between assessment (weighing factors) and evaluation (judging value and reaching conclusions) in exam responses
- Support all observations with precise quantitative evidence from your investigation