Atlas and map skills (Edexcel GCSE Geography A): Revision Notes
Atlas and Map Skills
Atlas and map skills are fundamental geographical tools that you'll need across all your GCSE exam papers. These skills enable you to interpret and describe the distributions and patterns shown on different types of maps, which forms a core part of geographical analysis and understanding.
Understanding Atlas Maps
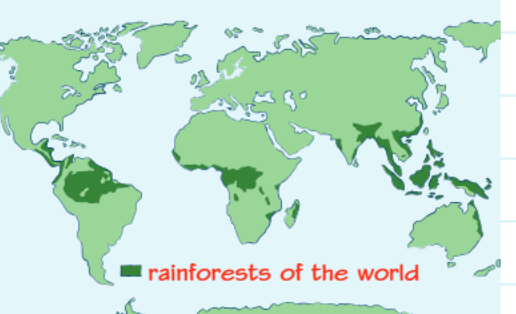
Atlas maps are powerful tools for displaying the distribution of various geographical features across different scales, from local to global. One of the most common applications is showing the distribution of vegetation types, such as the global spread of tropical rainforests.
Atlases are comprehensive collections of maps that contain multiple types of geographical information. Understanding the different types of maps available helps you select the most appropriate source for answering specific geographical questions.
Atlases contain several different types of maps, each designed to show specific geographical information:
Climate and weather maps reveal global variations in precipitation patterns, rainfall distribution, and temperature zones. These maps help you understand how climatic conditions vary across different regions and continents, which is essential for understanding ecosystem distribution and human activities.
Political maps display country boundaries and administrative divisions, helping you understand the political geography of different regions. These are particularly valuable when studying international relationships, comparing different nations, or understanding territorial disputes.
Relief maps illustrate the height and shape of the land, showing mountain ranges, valleys, plains, and other topographical features. This type of mapping helps you understand how physical geography influences human settlement patterns, economic activities, and transportation networks.
Population distribution maps demonstrate how people are spread within regions or countries, highlighting areas of high and low population density. These maps often reveal patterns related to physical geography, economic opportunities, and historical settlement patterns.
In exam situations, you may be required to use information from multiple types of atlas maps to provide comprehensive answers. This skill of synthesising information from different sources demonstrates higher-level geographical thinking and can help you achieve better marks.
Describing Patterns and Distributions
When analysing maps, you need specific vocabulary to accurately describe the patterns and distributions you observe. Using precise geographical terminology helps you communicate your observations clearly and demonstrates your understanding of spatial relationships.
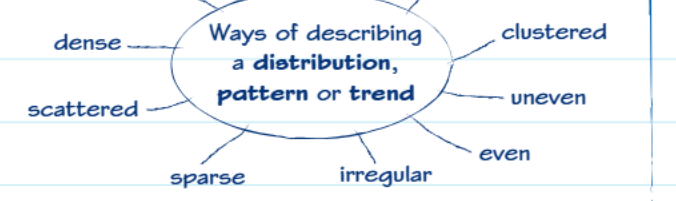
Dense patterns occur when geographical features are packed closely together within a relatively small area, showing high concentration. Sparse patterns represent the opposite situation, where features are spread out with significant gaps between them, indicating low concentration.
Clustered patterns indicate that features group together in specific locations, often forming distinct concentrations. Scattered patterns show features distributed randomly across an area without clear groupings or organisation.
Linear patterns follow a line or corridor, such as settlements along a river valley, coastal area, or transport route. Even patterns display regular, uniform spacing between features, while uneven patterns show irregular spacing with some areas having higher concentrations than others.
Irregular patterns don't follow any clear geometric shape or predictable structure, appearing random or chaotic in their distribution.
Mastering these descriptive terms allows you to communicate your map observations precisely, which is crucial for achieving high marks in examination questions that require pattern analysis.
Structuring Your Pattern Descriptions
The GSE structure provides an excellent framework for organising your descriptions of patterns and distributions. This method ensures you provide comprehensive, well-structured answers that cover all important aspects of what you observe.
The GSE Structure - Essential for Exam Success
G - General: Describe the overall trend or pattern across the entire map or study area S - Specific: Provide particular examples that illustrate and support the general trend E - Exception: Note any anomalies that don't fit with the general pattern
This systematic approach ensures you address all aspects of pattern analysis and helps prevent you from missing important details that could earn additional marks.
G - General involves describing the overall trend or pattern you can observe across the entire map or study area. This gives the examiner a broad understanding of the main characteristics of the distribution and establishes the context for your more detailed observations.
S - Specific requires you to provide particular examples that illustrate and support the general trend or pattern you've identified. These concrete examples demonstrate your ability to read the map accurately and show that you can support general statements with evidence.
E - Exception involves noting any anomalies or areas that don't fit with the general pattern or trend you've described. Identifying exceptions shows sophisticated analytical thinking and attention to detail, demonstrating that you can recognise complexity in geographical patterns.
Worked Example: UK Rainfall Distribution
Let's examine how to apply these skills using a practical example of UK rainfall distribution. By studying how annual precipitation varies across Britain, you can see how to implement the GSE structure effectively.
Worked Example: Applying GSE Structure to UK Rainfall
When describing the UK's rainfall pattern, you might structure your answer as follows:
General: The United Kingdom displays significant regional variation in rainfall distribution, with a clear west-to-east gradient where western and northern areas receive substantially more precipitation than eastern and southern regions.
Specific: Western areas, particularly parts of Scotland, Wales, and the Lake District, receive over 1500mm of rainfall annually. In stark contrast, parts of eastern England, especially areas around East Anglia and the Thames Valley, receive less than 625mm per year on average.
Exception: While the general pattern shows decreasing rainfall from west to east, some localised areas in eastern regions receive moderate rainfall amounts that don't fit this overall trend, possibly due to local topographical influences or coastal effects.
This example demonstrates how the GSE structure helps you provide a complete, well-organised description that covers the main pattern, supporting evidence, and recognition of complexity.
Key Exam Tips for Success
Critical Exam Strategy Points
When answering questions about patterns and distributions, focus specifically on describing what the map shows rather than attempting to explain why the pattern exists. Pay close attention to the command word in the question - if it asks you to "describe," stick to observations rather than explanations or analysis.
Always support your descriptions with specific evidence from the map, including place names, numerical data, colours, or symbols shown in the legend. This demonstrates your ability to read and interpret cartographic information accurately.
Always support your descriptions with specific evidence from the map, including place names, numerical data, colours, or symbols shown in the legend. This demonstrates your ability to read and interpret cartographic information accurately and provides concrete evidence for your observations.
Carefully examine the scale and legend of any map you're analysing, as these provide crucial information for understanding what the map represents and the significance of different colours, symbols, or categories used.
Remember that you may need to combine information from different types of maps or sources to answer more complex questions effectively. Practice identifying connections between physical geography, human activities, and spatial patterns.
Key Points to Remember:
- Atlas maps display distributions of various geographical features including climate patterns, political boundaries, relief, and population density
- Use precise vocabulary such as "dense," "sparse," "clustered," "scattered," and "linear" to describe spatial patterns accurately
- Apply the GSE structure (General, Specific, Exception) to create comprehensive and well-organised pattern descriptions
- Focus on describing observable patterns rather than explaining their causes unless specifically asked
- Always support your descriptions with specific evidence from maps, including place names, data values, and reference to map legends