Cross sections and relief (Edexcel GCSE Geography A): Revision Notes
Cross sections and relief
What are cross sections and relief?
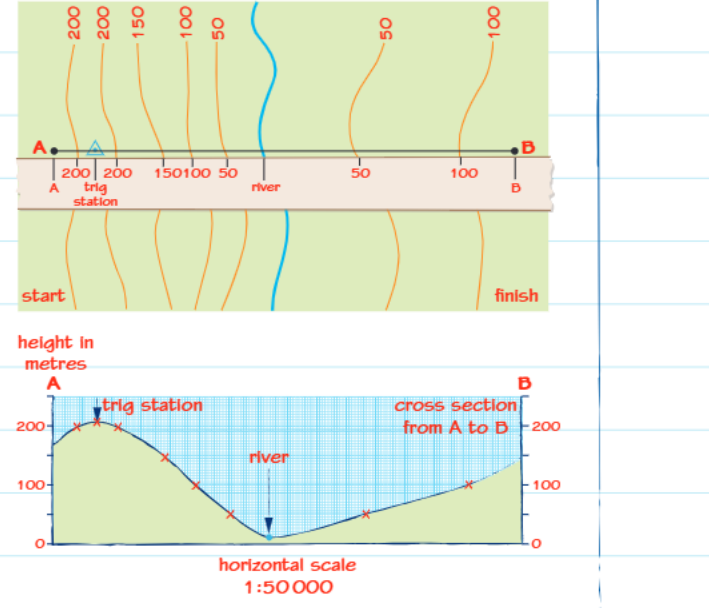
A cross section provides a sideways view of how the land's height changes along a specific straight line across the landscape, known as a transect. This technique helps geographers visualise the relief - which refers to the variations in elevation and physical features of the terrain. Cross sections are essential tools for understanding landscape characteristics, as they transform the bird's-eye view of a topographic map into a profile that shows hills, valleys, and other landforms from the side.
Cross sections are fundamental tools in geography and geology, allowing us to understand three-dimensional landscapes from two-dimensional maps. They're particularly valuable for analysing drainage patterns, identifying potential hazards, and planning construction projects.
You might encounter questions asking you to create a cross section from a given transect line, or to analyse and comment on an existing cross section diagram.
How to draw a cross section
Creating an accurate cross section requires a systematic approach using simple tools and careful observation. The process involves transferring height information from contour lines on a topographic map to create a side-view profile.
Step-by-step method:
-
Position your paper strip - Take a thin strip of paper and align it exactly along the transect line marked on your map. This strip will capture all the elevation points you need.
-
Mark contour intersections - Identify where the major contour lines (usually shown in brown) cross your transect line. Make small marks on your paper strip at each of these intersection points.
-
Note important features - Mark the positions of significant landscape features such as rivers, roads, peaks, or other notable points that lie along your transect line.
-
Set up your graph - Draw a horizontal line on graph paper to serve as your baseline (x-axis). Position your marked paper strip along this line, ensuring proper alignment.
-
Plot the elevations - Using the height values from each contour line, mark points vertically above your baseline. Connect these points with a smooth line to create your cross section profile.
Worked Example: Drawing a Cross Section
Given: A transect line A-B crosses contour lines at 100m, 150m, 200m, and 250m elevation.
Step 1: Mark these points on your paper strip as it lies along line A-B Step 2: Transfer to graph paper with horizontal distance on x-axis Step 3: Plot points at (0km, 100m), (0.5km, 150m), (1.2km, 200m), (1.8km, 250m) Step 4: Connect with a smooth curve to show the landscape profile
Understanding slopes from contour lines
The spacing between contour lines on a topographic map provides crucial information about the steepness of slopes. This relationship is fundamental to reading and interpreting topographic maps effectively.
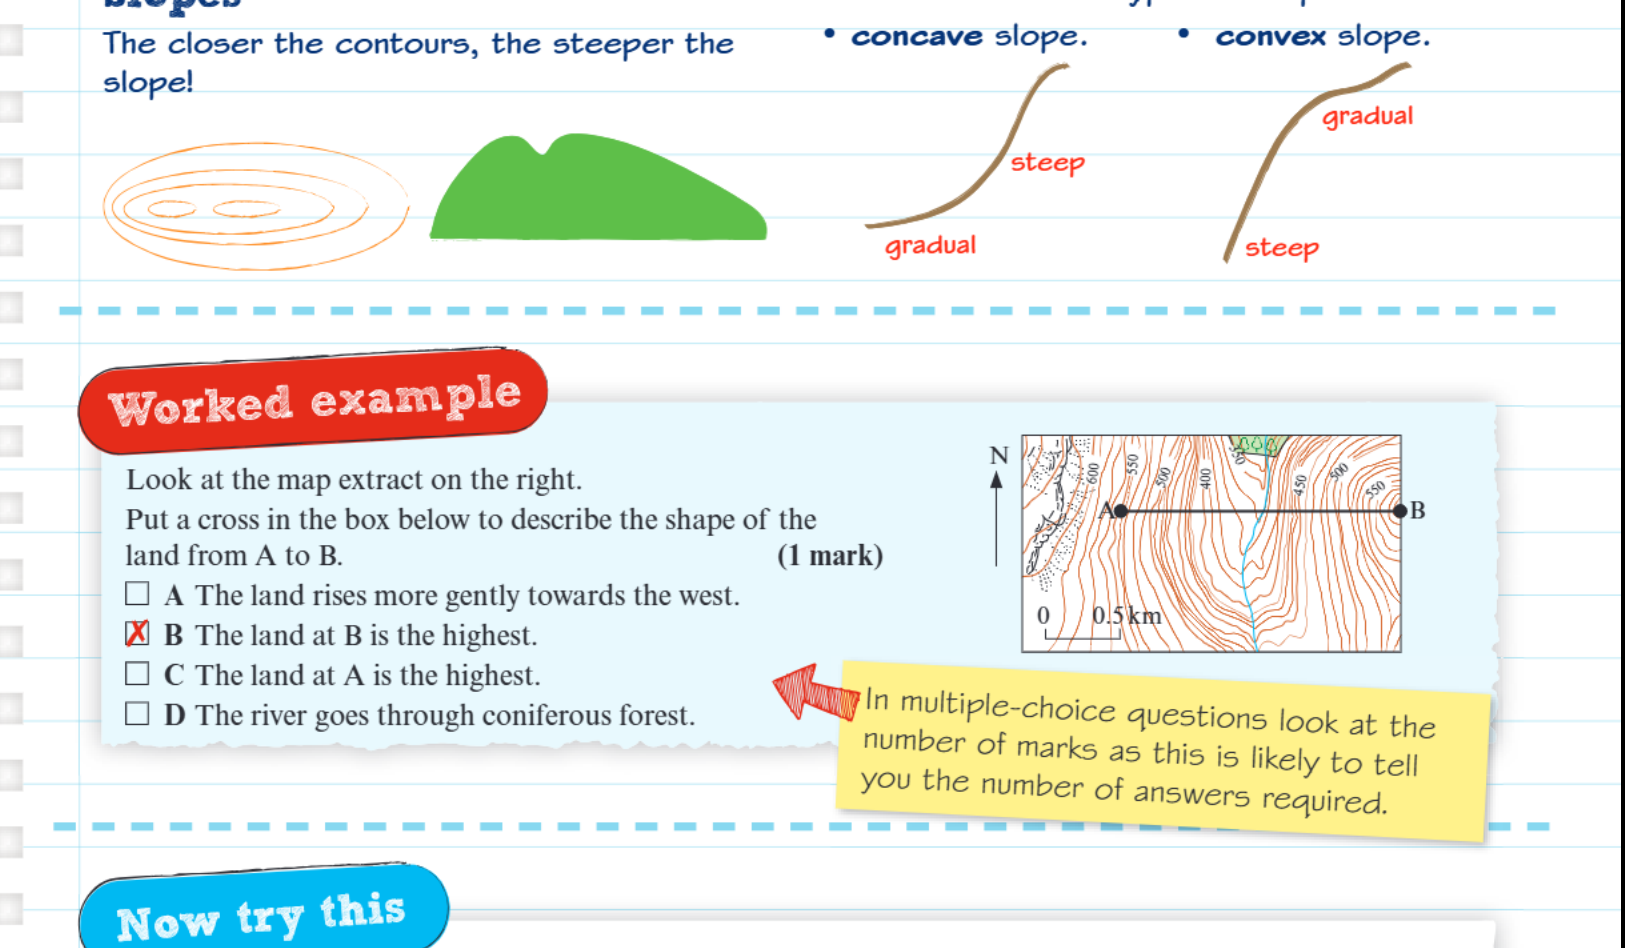
When contour lines appear close together, they indicate that the elevation changes rapidly over a short horizontal distance, creating a steep slope. Conversely, when contour lines are spaced far apart, the elevation changes gradually over a longer distance, indicating a gentle slope.
Key principle: The closer the contour lines, the steeper the slope
This is the most important relationship to remember when interpreting topographic maps. Always look at contour line spacing first when assessing terrain steepness.
This relationship helps you identify different types of terrain features, such as cliff faces (extremely close contour lines), gentle hills (widely spaced lines), and river valleys (V-shaped contour patterns).
Types of slopes
Slopes can be classified into two main categories based on how their steepness changes along their length. Understanding these patterns helps in analysing landforms and predicting processes like water flow and erosion.
Slope types are particularly important for understanding erosion patterns, water drainage, and even planning hiking routes or construction projects.
Concave slopes begin with a gentle gradient, become steeper in the middle section, then return to a gentler gradient at the bottom. This creates a inward-curving profile that resembles the shape of a cave or bowl. Concave slopes are common on hillsides where weathering and erosion have created a characteristic scooped appearance.
Convex slopes start with a steep gradient, transition to a gentler section in the middle, then become steep again towards the bottom. This creates an outward-bulging profile. Convex slopes often form on hilltops and ridges where the land curves away from the highest point.
These slope types significantly influence water drainage patterns, soil deposition, and vegetation distribution across the landscape.
Interpreting cross sections in exams
When answering exam questions about cross sections, focus on describing the elevation changes, identifying the highest and lowest points, and noting any significant features along the transect.
Pay careful attention to the scale information provided, as this helps you understand both the horizontal distances and vertical elevations accurately. Multiple-choice questions often test your ability to match cross section profiles with topographic map features, so practice connecting the contour line patterns you see on maps with their corresponding cross section appearances.
Common Exam Mistakes to Avoid:
- Forgetting to check the scale before making measurements
- Confusing concave and convex slope patterns
- Not identifying where rivers cross the transect (they're always in valleys)
- Failing to note the direction of the transect line when describing features
Look for key indicators such as where rivers cross the transect (these typically appear in valleys at lower elevations) and identify prominent peaks or high points that would appear as the highest parts of your cross section profile.
Key Points to Remember:
- Cross sections show the side view of landscape relief along a straight transect line
- Close contour lines indicate steep slopes, while widely spaced lines show gentle slopes
- Concave slopes curve inward (gradual-steep-gradual pattern)
- Convex slopes bulge outward (steep-gradual-steep pattern)
- Always check the scale when interpreting elevation and distance measurements