Sketch maps and annotations (Edexcel GCSE Geography A): Revision Notes
Sketch maps and annotations
What are sketch maps?
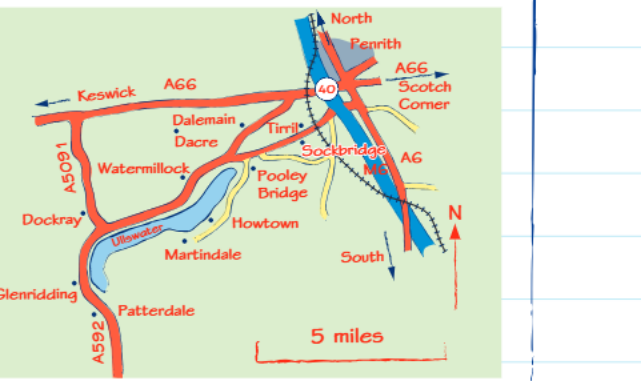
Sketch maps are straightforward drawings that represent a particular place or geographical area. These simplified visual representations serve as valuable tools throughout your geography studies, helping you demonstrate your understanding of locations, features, and spatial relationships. You might find yourself creating sketch maps for various units in your course, whether you're studying physical landscapes, human geography, or environmental issues.
The beauty of sketch maps lies in their simplicity - they don't need to be artistic masterpieces, but rather clear and informative diagrams that communicate geographical information effectively.
Key characteristics of drawing sketch maps
When creating sketch maps, you'll be working with several important principles that make them effective geographical tools. These maps can be developed using various sources of information, including existing maps, photographs, or direct field observations when you're studying an area in person.
Sketch maps focus on displaying the locations of fundamental geographical features rather than every minor detail. This selective approach helps viewers quickly identify and understand the most important elements of an area. The labelling system used is deliberately simple, avoiding complex terminology or excessive detail that might confuse the reader.
Most sketch maps are drawn from an aerial perspective, giving viewers a bird's-eye view of the area being studied. This viewpoint makes it easier to show spatial relationships between different features and provides a clear overview of the geographical layout.
One of the most valuable aspects of sketch maps is their flexibility for annotation. You can add explanatory notes and detailed information to enhance understanding and provide context for the features you've illustrated.
Sketching, labelling and annotating techniques
The process of creating effective sketch maps involves careful consideration of what to include and how to present information clearly. When working from photographs or existing sketches, you'll apply the same labelling and annotation techniques to maintain consistency in your geographical communication.
A crucial principle is selectivity - you should only include features that are directly relevant to the question or topic you're addressing. This focused approach prevents your sketch from becoming cluttered and ensures that viewers can easily identify the most important information.
When drawing, remember that clarity is more important than artistic skill. Create clean, simple lines and don't worry about producing a work of art. Including a frame around your sketch helps define the boundaries of your study area and provides a neat, professional appearance.
The distinction between labels and annotations is fundamental to effective sketch map creation. Understanding this difference will significantly improve the quality and effectiveness of your geographical communication.
Labels serve as simple identifiers - they might be single words or brief phrases that tell you what something is. For example, you might label a river, mountain, or settlement with its name or type.
Annotations go significantly further by providing explanatory information. These are complete sentences that offer detailed explanations about features, processes, or relationships. Annotations help viewers understand not just what they're looking at, but why it's important or how it works.
Understanding the difference between labels and annotations
This distinction is so important that it deserves detailed exploration with practical examples.
Critical Concept: Labels vs Annotations
- Labels: Simple identifiers (single words or brief phrases) that tell you WHAT something is
- Annotations: Complete sentences that explain WHY something is important or HOW it works
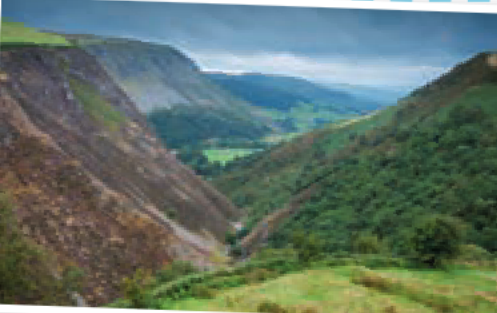
Worked Example: Valley Landscape Sketch
Labels might include:
- "coniferous forest"
- "steep sided V-shaped valley"
- "deciduous woods"
Annotations would explain:
- "Flat valley floor used for farming due to fertile alluvial deposits"
- "Erosion of debris from slope mass movement caused by freeze-thaw weathering"
- "Coniferous forest thrives on north-facing slopes due to reduced sunlight and cooler temperatures"
This combination of labels and annotations creates a comprehensive visual tool that both identifies features and explains their geographical importance.
Practical application with ordnance survey maps
Working with Ordnance Survey (OS) maps provides excellent practice for developing your sketch mapping skills. These detailed maps contain wealth of information that you can extract and simplify into sketch form.
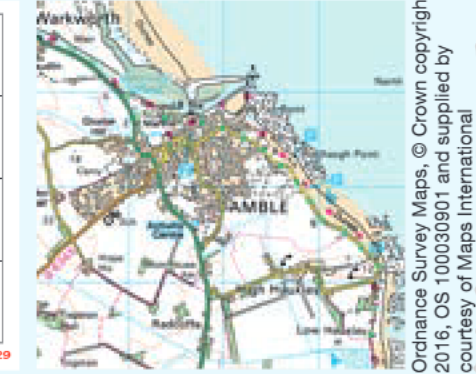
When examining OS map extracts, you'll need to identify different types of features and mark them appropriately on your sketch maps. For example, you might be asked to locate tourist information features, which appear as specific symbols on OS maps, or identify water features like rivers, lakes, or coastal areas.
The key skill lies in translating the detailed, standardised symbols of OS maps into simple, clear representations on your sketch maps while maintaining geographical accuracy and relevance to your study objectives.
Key Points to Remember:
- Sketch maps are simple drawings that show basic geographical features and their locations - they don't need to be artistic masterpieces
- Labels identify what features are (single words or short phrases), while annotations explain their significance or processes (complete sentences)
- Only include features relevant to your question or study focus to avoid cluttering your sketch
- Draw from an aerial viewpoint when possible, and always include a frame to define your study area boundaries
- Use sketch maps as flexible tools that can be enhanced with annotations to demonstrate your geographical understanding