Hydrographs and Flooding (OCR GCSE Geography A (Geographical Themes)): Revision Notes
3.3.5 Hydrographs and Flooding
Hydrographs
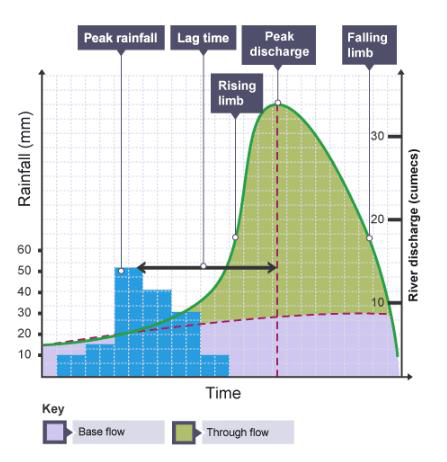
River discharge is volume of water flowing in a river per second. It's measured in cubic metres per second. Hydrographs show how discharge at a certain point in a river changes over time in relation to rainfall.
Keywords:
- Peak discharge:
- Maximum amount of water held in the channel.
- Peak rainfall:
- Maximum amount of rainfall (millimetres).
- Lag time:
- Time taken between peak rainfall and peak discharge.
- Rising limb:
- Shows the increase in discharge on a hydrograph.
- Falling limb:
- Shows the return of discharge to normal/base flow on a hydrograph.
- Base flow:
- The normal discharge of the river.
Lag Time
Factors Influencing Lag Time
-
Size of drainage basin
-
Vegetation
-
Valley side steepness
-
Soil type
-
Short or Long Lag Time:
- Influenced by factors such as vegetation.
- No Vegetation: Water runs off into the river quicker, leading to a short lag time.
- Plenty of Vegetation: Plants intercept rainfall, leading to a longer lag time. A short lag time means water reaches the river quickly, increasing flood risk.
Human & Physical Factors Affecting Flood Risk
Factors Affecting Flood Risk
-
Rainfall: After a long period of rain, the soil becomes saturated. Any further rain can't infiltrate, which increases runoff into rivers. This increases discharge, so flooding is more likely.
-
Trees: Trees intercept and rainwater, and also take up water from the ground. Cutting down trees therefore by deforestation increased the risk of floods.
-
Rock Type: Clay soils and some rocks are impermeable and don't allow water through and run off is increased.
-
Relief: If a river has steep sides, water will reach the river much quicker, increasing discharge and making flooding more likely.
-
Land Use: Buildings are often made from impermeable materials like concrete, as well as being surrounded by roads. Impermeable surfaces increase runoff and drains quickly take water to rivers.