Graphical Skills (OCR GCSE Geography B (Geography for Enquiring Minds)): Revision Notes
Graphical skills
Understanding and interpreting different types of graphs and charts is essential for presenting and analysing geographical data. Each type of graphical representation has specific purposes and is suited to displaying particular kinds of information.
Mastering graphical skills allows you to effectively communicate geographical patterns, trends, and relationships in a visual format that is easier to understand than raw numerical data.
Line graphs
Line graphs are used to display how data values change over time or across space. The horizontal axis (x-axis) typically shows time periods or distances, whilst the vertical axis (y-axis) shows the values being measured.
These graphs are particularly useful in geography for tracking trends and patterns. For example, you could use a line graph to display changes in a country's employment structure across different economic periods. The graph clearly shows how the workforce has shifted between different economic sectors over time.
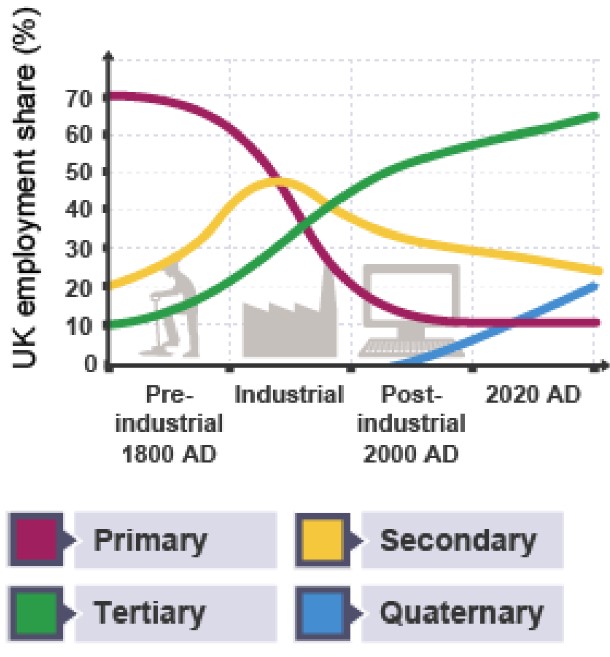
Worked Example: Reading Employment Structure from a Line Graph
In the post-industrial era shown above:
- 11% of workers are employed in primary industries (such as farming and mining)
- 31% in secondary industries (manufacturing)
- 54% in tertiary industries (services)
- 4% in quaternary industries (knowledge-based services)
Notice how these percentages total 100%, which is typical when showing proportions of a whole.
Exam tip: When describing a line graph, always identify the overall trend first, then mention specific values or time periods where significant changes occur.
Bar charts
Bar charts display grouped data using rectangular bars, where the height or length of each bar represents the data value. They are excellent for comparing different categories or groups at a glance.
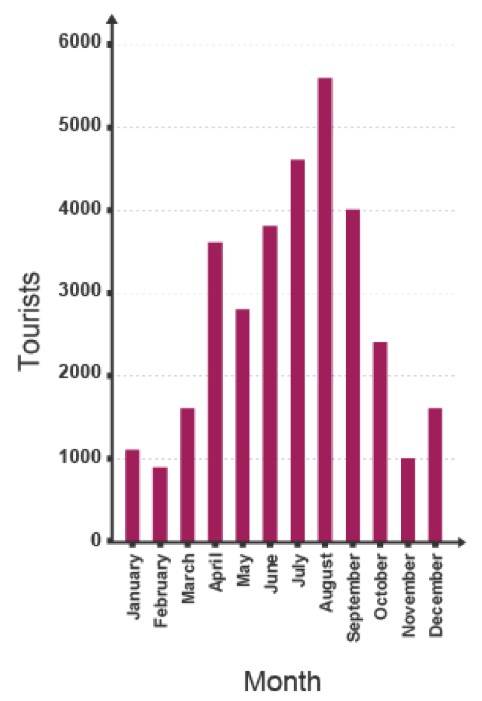
A simple bar chart might show the number of tourists visiting a resort during each month of the year. The bars make it easy to identify peak and low seasons quickly.
Divided bar charts
Divided bar charts (also called stacked bar charts) break down each bar into segments to show additional detail about the data. Each segment represents a different category within the total.
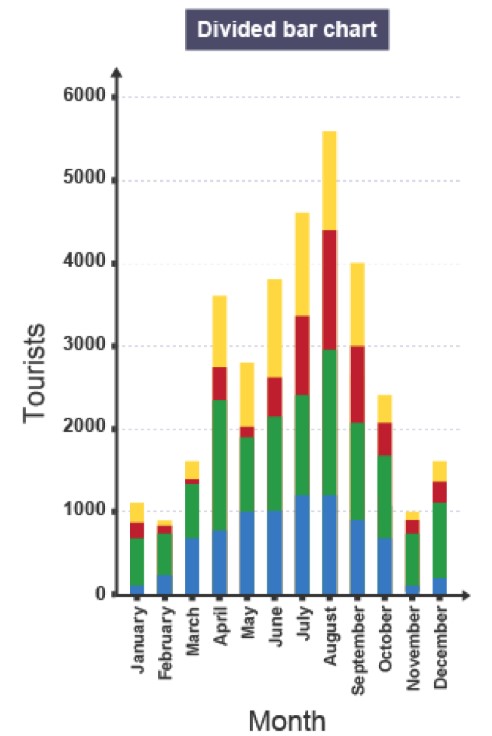
For instance, a divided bar chart could display monthly tourist numbers whilst also showing the age breakdown of those tourists. The different coloured segments within each bar reveal how the composition changes month by month. These charts can be drawn vertically or horizontally depending on preference and space.
Exam tip: When analysing divided bar charts, look for patterns in both the total height and the relative sizes of the segments.
Population pyramids
Population pyramids are a specialised form of bar chart that show the age and gender structure of a population. Unlike standard bar charts, the bars extend horizontally from a central axis.
The vertical axis (y-axis) displays age groups, typically in five-year bands. The horizontal axis (x-axis) shows the number or percentage of people. Bars extending to the left represent males, whilst bars extending to the right represent females. This format makes it easy to compare the male and female populations across different age groups and identify patterns such as ageing populations or youth bulges.
Exam tip: Population pyramids reveal important demographic information. Look at the shape - is it wide at the base (young population) or top-heavy (ageing population)?
Climate graphs
Climate graphs combine two graph types - bar charts and line graphs - to show both temperature and precipitation data for a location over a twelve-month period.
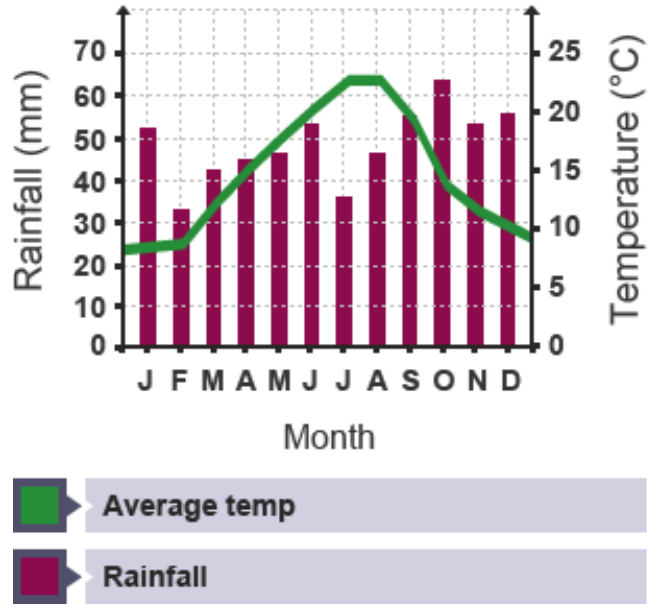
The horizontal axis shows the months of the year (usually abbreviated to single letters: J F M A M J J A S O N D). There are two vertical axes: one showing rainfall in millimetres (usually on the left) and another showing temperature in degrees Celsius (usually on the right). Rainfall is represented by bars, whilst average temperature is shown as a line connecting monthly values.
This dual representation allows you to see seasonal patterns and the relationship between temperature and rainfall at a glance, making climate graphs particularly valuable for comparing different locations or identifying climate types.
Exam tip: When describing a climate graph, mention both temperature and rainfall patterns. Look for seasonal variations and any relationship between the two variables.
Histograms
Histograms look similar to bar charts but serve a different purpose. Rather than showing grouped categorical data, histograms display frequency distributions - showing how often values occur within specific ranges.
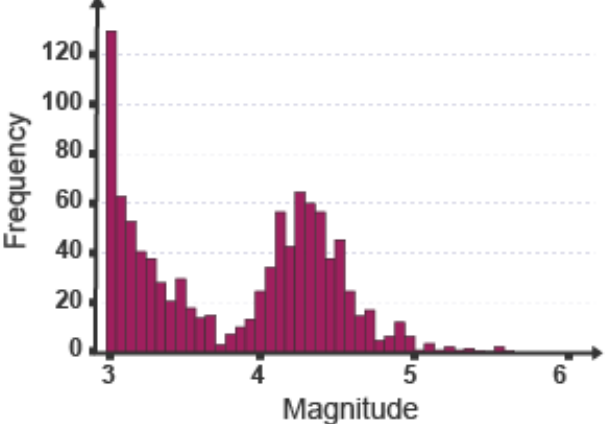
A histogram might show the frequency of earthquakes of different magnitudes on the Richter scale. The bars touch each other (unlike in bar charts) because the data is continuous rather than grouped into separate categories.
Key difference: Bar charts show categories (like months or countries), whilst histograms show the frequency of continuous data (like measurements or values).
Pie charts
Pie charts represent data as a circle divided into segments, with each segment showing a proportion of the whole. They are particularly effective for displaying percentages or proportions that add up to 100%.
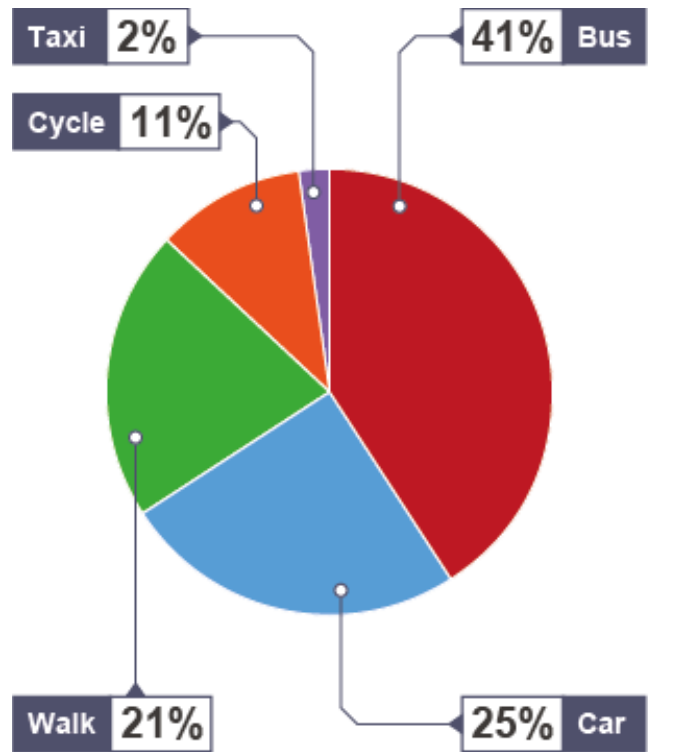
For example, a pie chart could illustrate how students travel to school, with each segment representing a different transport method. Since a circle contains 360 degrees, you can calculate the angle for each segment using this formula:
Worked Example: Calculating Pie Chart Angles
If 25 out of 100 students travel by car, the angle would be:
This means the car segment would occupy a quarter of the pie chart (90° out of 360°).
Exam tip: Pie charts work best when comparing a small number of categories (ideally 5-7 maximum). Too many segments become difficult to read and compare.
Scatter graphs
Scatter graphs (also called scatter plots) are used to investigate whether a relationship exists between two variables. Each point on the graph represents a pair of values, plotted using the x-axis and y-axis.
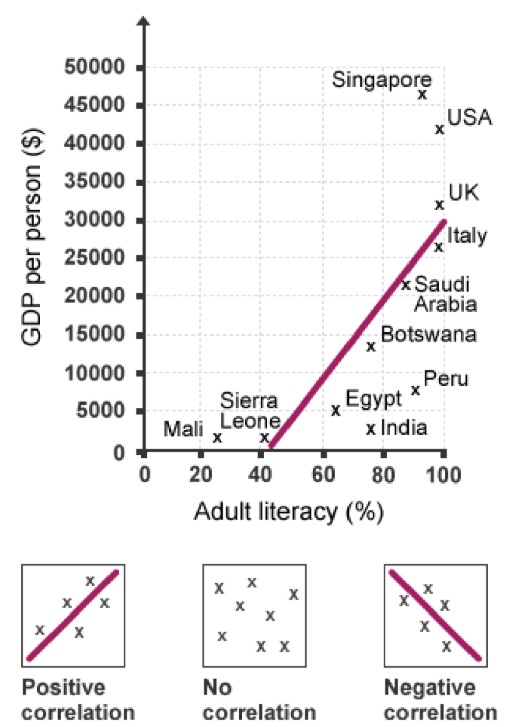
For example, a scatter graph could explore the relationship between adult literacy rates and GDP per person across different countries. By plotting multiple countries, patterns may emerge that suggest a connection between the two variables.
Understanding correlation
To identify patterns in scatter graphs, geographers draw a line of best fit - a straight line that runs through the centre of the data points, ideally with roughly equal numbers of points on either side.
The relationship between variables is called correlation, which can be:
Types of Correlation
Strong correlation: The data points cluster closely around the line of best fit, suggesting a clear relationship.
Weak correlation: The data points are spread far from the line of best fit, suggesting little or no relationship.
Positive correlation: As one variable increases, the other also increases. The line of best fit slopes upward from bottom left to top right.
Negative correlation: As one variable increases, the other decreases. The line of best fit slopes downward from top left to bottom right.
No correlation: The points show no clear pattern, and a meaningful line of best fit cannot be drawn.
Exam tip: When asked to describe correlation, always state whether it's positive or negative, and whether it's strong or weak. Support your answer by referring to the pattern of points.
Proportional symbols
Proportional symbols add an extra dimension to graphs by varying the size of symbols (usually circles) to represent different data values. The larger the symbol, the greater the value it represents.
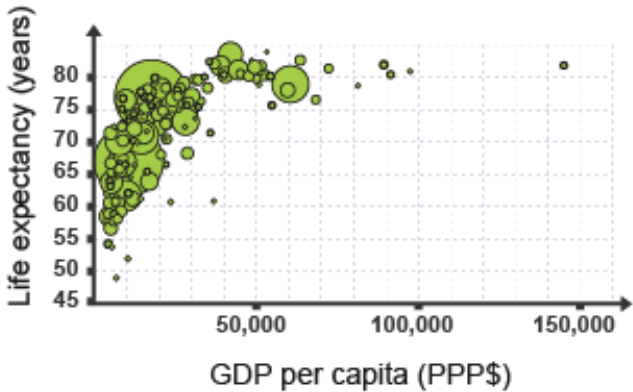
This technique is useful when displaying three variables simultaneously. For instance, a graph might plot life expectancy against income for various countries, whilst also showing each country's population size through differently-sized circles. This allows comparison across multiple dimensions at once.
Proportional symbols can also be added to maps to show spatial variations in data values, making them a versatile tool for geographical analysis.
Pictograms
Pictograms function like bar charts but use small pictures or icons instead of plain rectangular bars to represent data. This makes them more visually appealing and sometimes easier to understand at first glance.
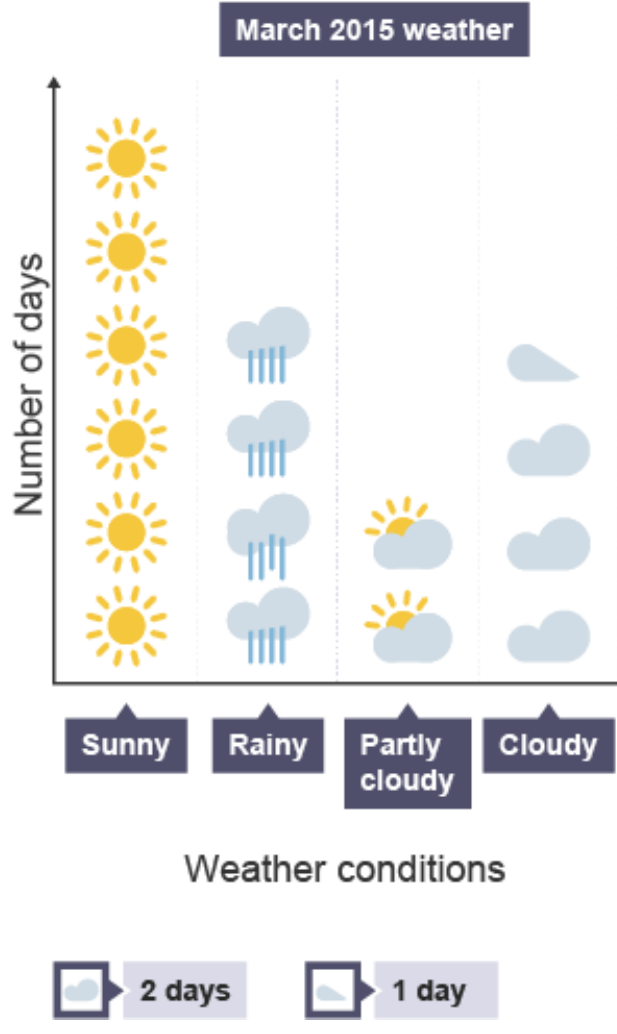
A pictogram might display weather conditions experienced over a month, using weather symbols to show the number of sunny, rainy, partly cloudy, and cloudy days. Typically, each icon represents a specific value (such as 2 days), with half-icons representing half that value (1 day).
Exam tip: When reading pictograms, always check the key carefully to understand what value each symbol represents.
Cross sections
Cross sections are line graphs that provide a sideways view of a landscape or feature. They are essential for showing changes in height or depth along a route or transect.

Cross sections can display landscape features such as hills, valleys, and slopes. When showing the depth of water bodies like rivers, they use negative numbers on the vertical axis so the graph visually represents depth below the surface rather than height above.
For hillsides and mountains, cross sections are constructed using contour lines from maps to determine the land's height at different points along the route.
Exam tip: When drawing cross sections from contour maps, plot the height accurately at each contour line, then join the points with a smooth curve to show the landscape's shape.
Radial graphs
Radial graphs (also called radar graphs or rose charts) display data radiating outward from a central point. They are particularly useful for showing directional data or comparing multiple variables simultaneously.
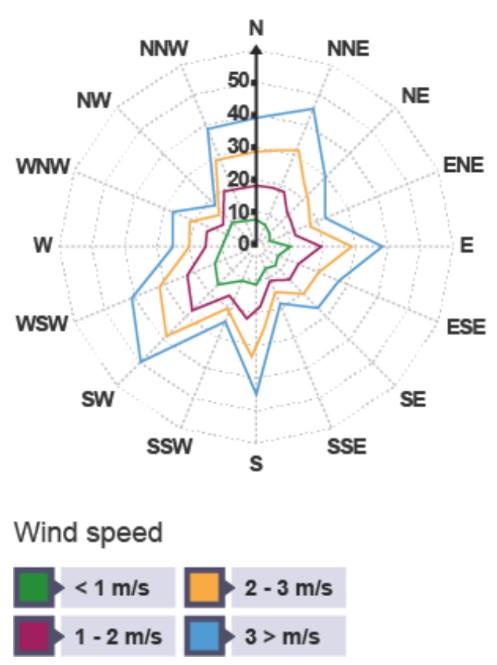
Wind roses are a common example in geography, showing wind speed and direction. The distance from the centre along each compass direction indicates the frequency or strength of winds from that direction. Multiple overlapping shapes in different colours can represent different time periods or wind speed categories.
Radial graphs are not limited to compass directions - they can display any type of data where multiple categories need to be compared in a circular format.
Exam tip: When interpreting radial graphs, look for the longest 'petals' or sections, as these indicate the dominant directions or highest values.
Summary
Key Points to Remember:
- Line graphs track changes over time or space, with time/distance on the x-axis
- Bar charts compare categories using rectangular bars; divided bar charts break these down further into sub-categories
- Histograms show frequency distributions of continuous data, unlike bar charts which show grouped categories
- Pie charts display proportions of a whole using segments of a circle (360 degrees total)
- Scatter graphs reveal relationships between two variables; use line of best fit to identify positive, negative, strong, or weak correlations
- Climate graphs combine bars (rainfall) and lines (temperature) to show annual weather patterns
- Population pyramids use horizontal bars to show age and gender structure of populations
- Cross sections provide sideways views of landscapes or depths, constructed using contour lines or measurements
- Radial graphs display directional data or multiple variables radiating from a central point
- Always check axes labels, units, and scales carefully when interpreting any graph