Map Skills (OCR GCSE Geography B (Geography for Enquiring Minds)): Revision Notes
Map Skills
Atlas maps - physical and human features
Atlases contain maps at various scales, from global to national level. These maps display different types of geographical information depending on their purpose.
Physical maps
Physical maps display natural landscape features across different scales. At a global level, these maps show major natural features including mountain ranges, lowland areas, significant river systems, seas, oceans, and ecosystems such as deserts and tropical rainforests. When viewing physical maps at a national scale, you can identify relief features (variations in height) and drainage patterns, particularly river networks.
Some physical maps represent features that are experienced rather than directly visible. Climate data, such as average temperature or rainfall distribution, falls into this category. These maps use colour coding or shading patterns to show variations across regions.
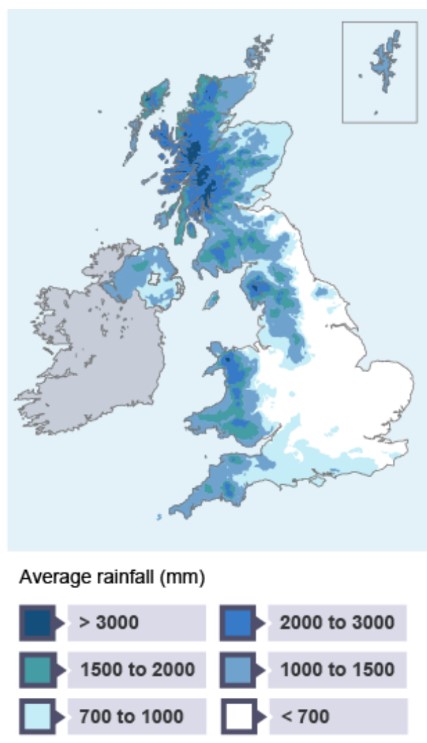
The map above demonstrates how rainfall data is presented using a choropleth technique, where different colours represent varying levels of precipitation. Notice how western regions typically receive higher rainfall than eastern areas.
Political and human maps
Political maps primarily show country boundaries and major urban centres. They help you understand territorial divisions and the location of capital cities and other significant settlements.
Human thematic maps display features created by people. These include:
- Population distribution patterns
- Migration flows between regions
- Transport networks and routes
- Settlement layouts and urban planning
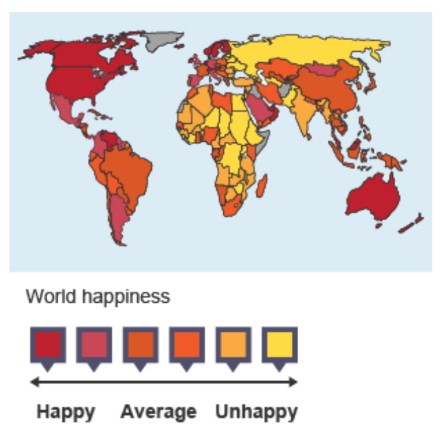
Some human maps represent data that is experienced rather than seen, such as life expectancy, living standards, or quality of life indicators.
When describing patterns on thematic maps, always refer to specific regions or countries and use data from the legend to support your observations.
Direction
Maps require a direction indicator to show orientation. Traditionally, north points towards the top of maps, with south at the bottom, east to the right, and west to the left.
Between the four cardinal directions (north, south, east, west) lie intermediate compass points. These are formed by combining the main directions. For instance, the direction between north and east is called north-east. When a direction lies closer to one cardinal point, it takes that name first, such as east-north-east.
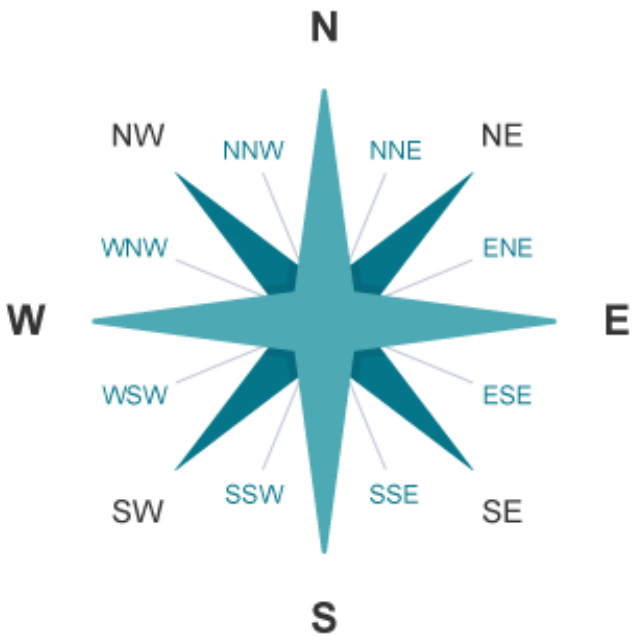
The 16-point compass rose shown above displays all major directional subdivisions used in navigation and map reading. Understanding these intermediate directions is essential for precise location description and navigation.
Latitude and longitude
These coordinate systems allow precise location identification on maps and globes.
Understanding the system
The Earth is spherical, so latitude and longitude are measured in degrees (°) of a circle.
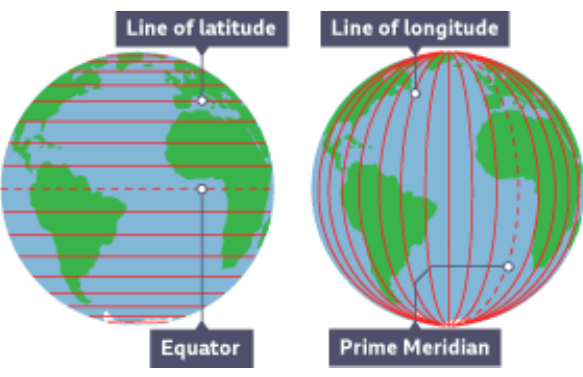
Lines of latitude:
- Run horizontally from east to west
- The Equator sits at 0° latitude
- Lines north of the Equator are labelled °N
- Lines south of the Equator are labelled °S
Lines of longitude:
- Run vertically from north to south
- The Prime Meridian (Greenwich Meridian) in London sits at 0° longitude
- Lines east of this meridian are labelled °E
- Lines west of this meridian are labelled °W
Writing Coordinates Correctly
When writing coordinates, latitude always comes first, followed by longitude.
Example: Manchester is located at 53.5°N, 2.2°W
- Latitude: 53.5°N (north of the Equator)
- Longitude: 2.2°W (west of the Prime Meridian)
Remember the phrase "Latitude is Flatitude" - latitude lines run horizontally like flat lines across the globe. This memory aid helps you avoid confusing latitude and longitude.
Ordnance Survey maps
The Ordnance Survey (OS) serves as Great Britain's official mapping agency. They produce regularly updated paper and digital maps for various users, from hikers to businesses.
Using a map key
OS maps use symbols to represent both physical and human features, making maps clearer and easier to read. Each map includes a key (or legend) that explains what these symbols represent. Learning common symbols is essential for interpreting OS maps effectively.
Scale and distance
Maps represent real-world features at a reduced size. The scale shows the relationship between distances on the map and actual distances on the ground.
Scale is expressed as a ratio. For example, 1:25,000 means that 1 cm on the map represents 25,000 cm (or 250 metres) in reality.
OS maps are available at different scales:
Large-scale maps:
- 1:1,250, 1:2,500, and 1:10,000
- Features appear larger and show more detail
- Suitable for individual towns and cities
Small-scale maps:
- 1:25,000, 1:50,000, and 1:100,000
- Features appear smaller but cover wider areas
- Useful for showing regions or counties
Larger scale numbers (like 1:100,000) actually show smaller-scale maps covering larger areas. Don't confuse the scale number with the scale type - this is a common mistake in exams.
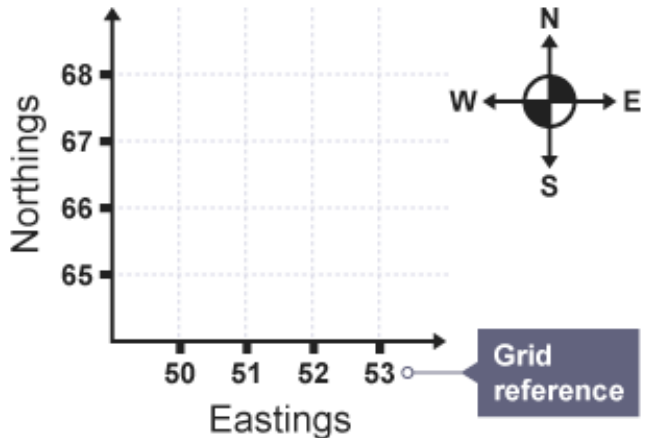
Four-figure and six-figure grid references
Grid references provide a systematic way to locate features on OS maps. Every OS map contains a grid shown by faint blue lines.
Eastings are the lines running along the bottom of the map (they increase as you travel eastward).
Northings are the lines running up the side of the map (they increase as you travel northward).
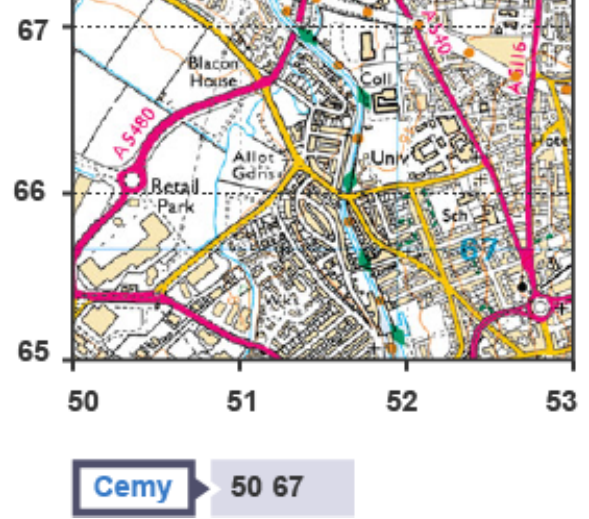
Four-figure grid references
These identify a complete grid square and are found using this method:
- Locate the grid square containing your feature
- Write the eastings number from the bottom-left corner of the square (two digits)
- Write the northings number from the bottom-left corner of the square (two more digits)
This gives you four digits in total.
Six-figure grid references
These pinpoint a specific location within a grid square with greater accuracy:
- Write the eastings number from the bottom-left corner, then add a third digit showing how many tenths across the square your feature lies
- Write the northings number from the bottom-left corner, then add a third digit showing how many tenths up the square your feature lies
This provides six digits for precise location identification.
Using Six-Figure Grid References
To locate a church within a grid square:
Step 1: Identify the bottom-left corner of the square
- Eastings: 34
- Northings: 67
Step 2: Estimate tenths across and up
- Church is approximately 7 tenths across the square (eastward)
- Church is approximately 3 tenths up the square (northward)
Step 3: Combine the numbers
- Final six-figure reference: 347 673
Remember the phrase "Along the corridor and up the stairs" - always read the eastings (along) before the northings (up). This is the correct order for all grid references.
Contours and spot heights
Height on OS maps is always measured in metres above sea level.
Spot heights show the exact elevation at a particular point, marked with a number on the map.
Contour lines are thin orange or brown lines connecting points of equal height. They reveal information about the landscape's gradient:
- Contour lines close together indicate steep slopes where height changes rapidly
- Contour lines far apart indicate gentle slopes where height changes gradually
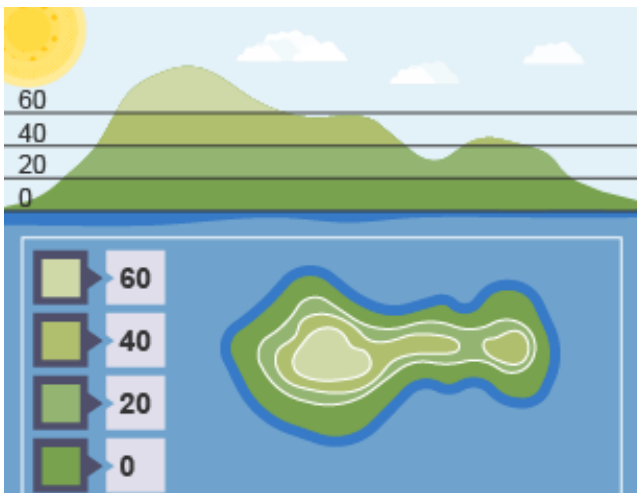
Cross-section diagrams can be created from contour lines to visualize the landscape profile. This technique helps you match the two-dimensional map representation to three-dimensional landscape features such as hills, valleys, and ridges.
When describing relief from a map, use terms like "steep", "gentle", "rapid change in height", and always quote specific heights from spot heights or contour lines. This demonstrates your ability to read and interpret the map accurately.
Other map representations
Sketch maps
Sketch maps are simplified drawings of landscapes. They highlight features that might be obscured in photographs or standard maps, such as the impact of tourism on an environment.
These can be drawn from two perspectives:
- Bird's-eye view (looking down from above)
- Horizon view (looking across the landscape)
You can create sketch maps during fieldwork or from photographs. Adding annotations makes them more useful for analysis.
Photographs
Different photographic perspectives serve different purposes in geography:
Ground photographs:
- Taken at ground level during fieldwork
- Captured using cameras or mobile devices
- Must be annotated to identify key features
- Show detailed close-up views
Aerial photographs:
- Taken from aircraft
- Cover broader areas than ground photographs
- Excellent for identifying spatial patterns and relationships
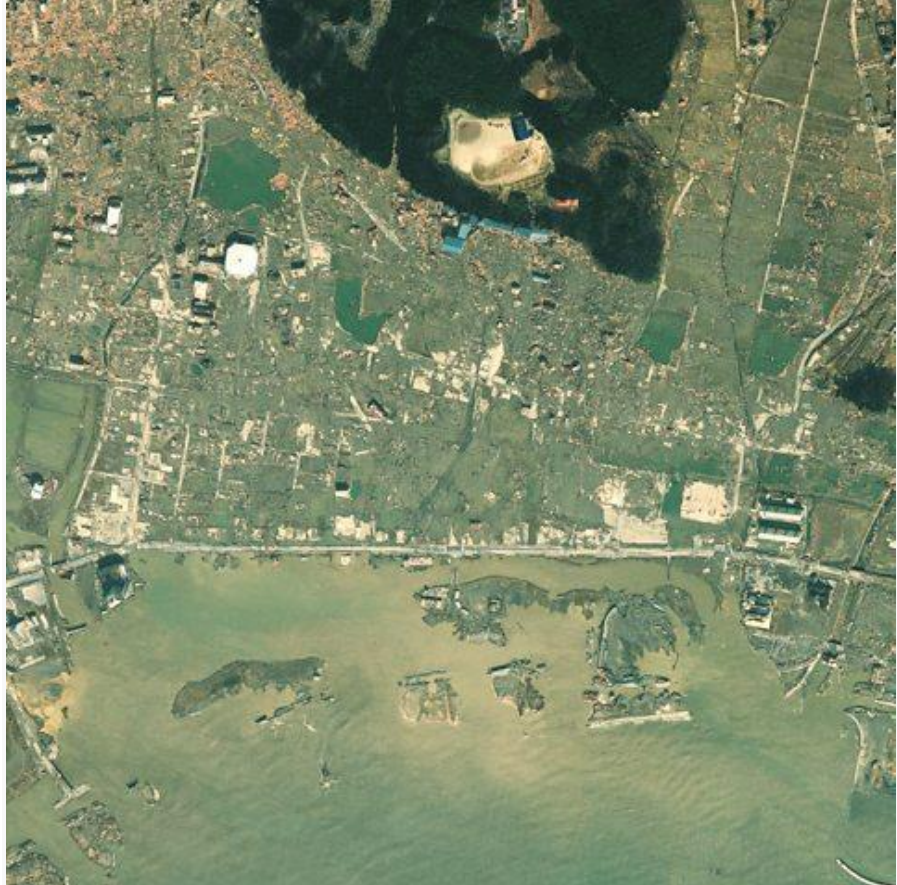
Satellite images:
- Captured by satellites orbiting Earth
- Show very extensive areas
- Provide less detail than closer images but reveal large-scale patterns
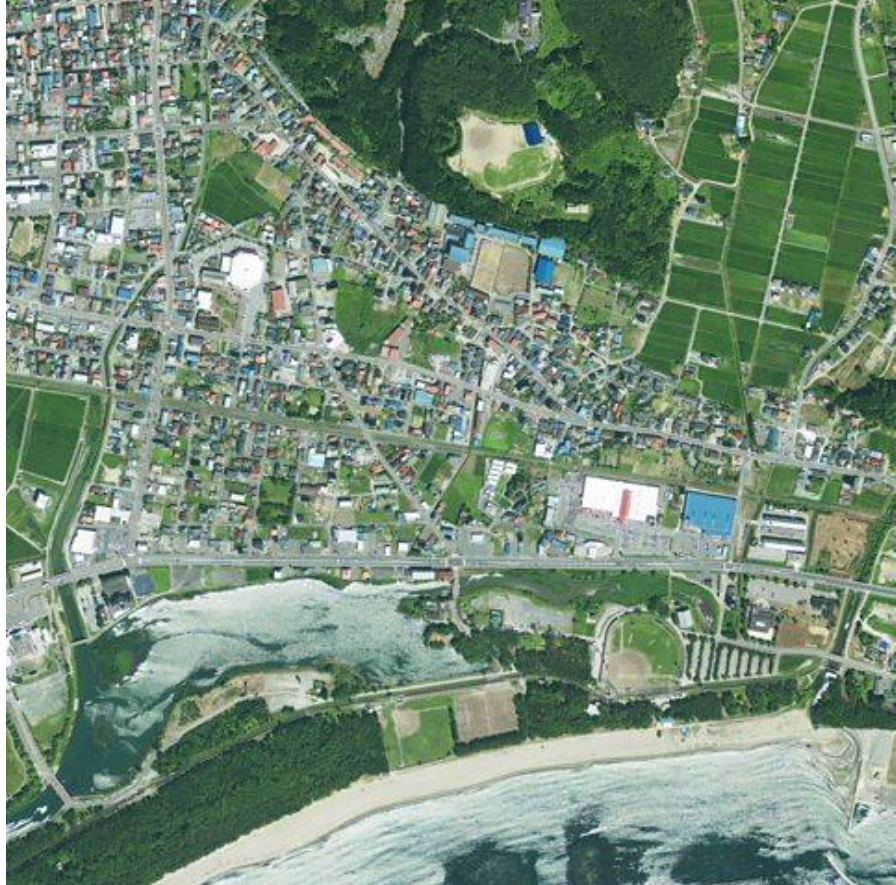
The satellite image above demonstrates how these photographs capture landscape features before significant events. Comparing before and after images helps geographers analyze change over time, such as the impact of natural disasters.
When analyzing photographs in exams, work systematically from foreground to background, or from one side to the other. Use geographical terminology and relate features to your case studies. This structured approach ensures you don't miss important details.
GIS maps
Geographical Information Systems (GIS) are digital maps with multiple data layers. These interactive maps can be customized to display specific information about a location.
Information layers can be presented as:
- Area shading - regions colored to show patterns or categories
- Graphs - bar charts, pie charts, or proportional symbols placed on the map
- Photographs - images linked to specific map locations
- Flow lines - arrows or lines showing movement between places
GIS technology allows geographers to analyze multiple data sets simultaneously and identify relationships between different geographical factors. This makes GIS particularly powerful for complex spatial analysis and decision-making.
Annotating maps and photographs
Annotations are detailed, explanatory labels that go beyond simple identification. They're crucial for geographical analysis as they allow you to interpret and compare different sources.
Effective annotations should:
- Identify both physical and human features
- Explain what the feature shows
- Use appropriate geographical terminology
- Make connections between features when relevant
In exams, annotations should demonstrate your geographical understanding, not just label obvious features. Explain why features are significant or how they relate to geographical processes. This shows higher-level thinking and analysis skills.
Geology maps
The British Geological Survey (BGS) produces detailed maps showing rock types beneath Great Britain's surface.
British geology
Great Britain sits atop diverse rock types formed during different geological periods under varying environmental conditions. For instance, mudstone formed over 200 million years ago when Britain had a desert climate.
Rock type influences several geographical factors:
- Landscape shape and relief
- Soil characteristics
- Drainage patterns
How Rock Type Affects Geography
Chalk bedrock produces alkaline, well-drained soils. Certain crops, like asparagus, thrive in these conditions because they:
- Prefer alkaline soil
- Have deep root systems to access water through the well-drained chalk
This demonstrates the direct link between geology and agriculture.
Identifying underground rock types is challenging except where soil and vegetation are thin, such as in mountainous areas. This makes geological maps particularly valuable.
Features of geological maps
Geological maps use colors and numbers to distinguish different rock types. Roads and settlements appear as faint layers beneath the geological information.
These maps also show:
- Faults - cracks in the rock, marked as solid black lines
- Thrusts - locations where rock has been forced upward, shown as alternating dashes and dots
Understanding geology helps explain landscape features and coastal processes, such as why certain rocks are more resistant to erosion than others.
When using geological maps in exams, relate rock types to their hardness and resistance to erosion. This helps explain landscape features like headlands and bays - harder rocks form headlands while softer rocks erode to form bays.
Remember!
Key Points to Remember:
-
Physical maps show natural features; political maps show boundaries and cities; human thematic maps display data about human activities
-
Latitude lines run east-west (horizontal); longitude lines run north-south (vertical)
-
Always read grid references "along the corridor first, then up the stairs" - eastings before northings
-
Contour lines close together = steep slopes; contour lines far apart = gentle slopes
-
Different map scales serve different purposes - large-scale maps (smaller numbers like 1:10,000) show more detail
-
Six-figure grid references provide more precise locations than four-figure references
-
GIS maps combine multiple data layers for complex geographical analysis