Inequalities (OCR GCSE Maths): Revision Notes
Inequalities
What are Inequalities?
Inequalities are a way to represent a range of possible values for a variable, rather than a specific value. They help describe situations where a value is larger or smaller than a given number, but not necessarily equal to it.
1. Common Symbols Used in Inequalities:
- means "less than"
- means "less than or equal to"
- means "greater than"
- means "greater than or equal to"
Examples:
- means can be any number less than , like , etc., but not .
- means can be , etc., but not any number less than .
- means is any number greater than , like but not !
2. Representing Inequalities on a Number Line:
A common type of question involves showing an inequality on a number line. This is straightforward once you understand the method.
Method:
- Draw a line for all the numbers for which the inequality is true.
- End the line with a circle. If the inequality includes "equal to" (like or ), colour in the circle. If it does not include "equal to" (like or ), leave the circle unfilled.
Visual Representation:
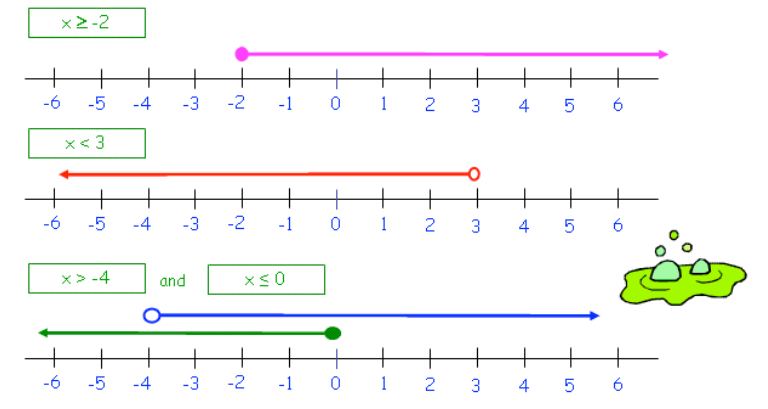
Examples: 4. :
- Draw a line starting at and going to the right (indicating values greater than ).
- Since the inequality is "greater than or equal to," the circle at is filled in.
- :
- Draw a line starting just left of and extending to the left.
- Because it's "less than" and not "equal to," leave the circle at unfilled.
- Combined Inequalities:
- and :
- Draw a line starting just right of to .
- Fill the circle at (since can equal ) but leave the circle at unfilled (since cannot equal ).
Working with Inequalities:
When solving inequalities, treat them much like equations. However, there's one important rule to remember: If you multiply or divide by a negative number, flip the inequality sign.
Example: If you start with , divide by to get . Notice how the sign flips from to .
3. Solving Linear Inequalities
Why Does the Sign Flip?
Imagine you start with the inequality (which is true).
- If you multiply both sides by , the inequality becomes , which is still true.
- But if you divide both sides by (a negative number), you get . Notice the sign flipped from > to < to maintain the truth of the statement. This flipping happens because dividing by a negative number reverses the order of the values on the number line.
Example 1: Solving a Linear Inequality Let's solve the inequality .
Step-by-Step Solution:
- Isolate the variable term:
- Subtract from both sides to get .
2. Solve for the variable:
- Divide both sides by .
Since we divided by a positive number, the inequality sign does not change.
Final Answer:
This means any value of that is or greater will satisfy the inequality.
Example 2: Solving an Inequality with Multiple Terms Let's solve the inequality .
Step-by-Step Solution:
- Move all terms to one side:
- Subtract from both sides:
- Isolate the term:
- Add to both sides:
- Then, divide by :
Final Answer:
This tells us that must be less than to satisfy the inequality.
Example 3: Solving an Inequality Involving a Negative Multiplier Now, let's solve the inequality .
Step-by-Step Solution:
- Expand the brackets:
- Distribute the across the terms inside the brackets:
- Isolate the term:
- Subtract from both sides:
- Solve for :
- Divide by , remembering to flip the inequality sign:
Final Answer:
This result tells us that must be less than to satisfy the inequality.
Example 4: Solving a Compound Inequality Let's solve the compound inequality .
Step-by-Step Solution:
- Unwrap the unknown variable in the middle:
- Start by subtracting from all three parts of the inequality:
- Isolate :
- Now, divide all parts by :
- Interpret the result:
- This means must be greater than and less than or equal to . Final Answer: and
4. Solving Linear Inequalities Graphically
Introduction to Graphical Inequalities
When solving linear inequalities graphically, the goal is to find the region on a graph that satisfies the given inequality or inequalities. This involves plotting lines on a graph and shading the correct region that represents the solution set.
Steps for Solving Linear Inequalities Graphically
- Pretend the inequality sign is an equals sign and draw the line.
- Decide whether the line should be dashed or solid:
- A solid line is used when the inequality is or (because points on the line are included in the solution).
- A dashed line is used when the inequality is or (because points on the line are not included in the solution).
- Choose a coordinate on either side of the line to determine which region satisfies the inequality.
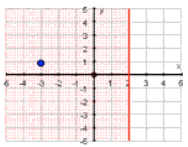
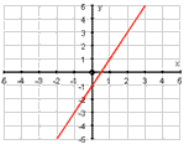
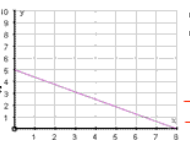
Example 1: Solve 10. Draw the line . 11. Notice it's a solid line because the inequality is . 12. Choose a point on one side of the line:
- Choose (), substitute into :
- This point does not satisfy the inequality, so the solution region is on the other side of the line.
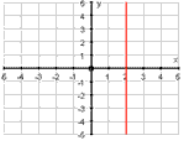
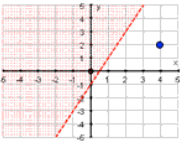
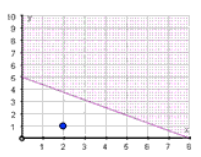
Example 2: Solve
- Draw the line .
- Notice it's a dashed line because the inequality is .
- Choose a point on one side of the line:
- Choose (), substitute into :
- This point does not satisfy the inequality, so the solution region is on the other side of the line.
Example 3: Solving Multiple Inequalities Together
Given the inequalities , , and :
- Solve each inequality graphically:
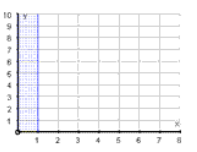
-
For , draw a solid line for and shade to the right.
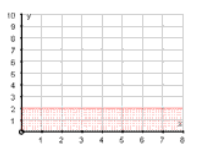
-
For , draw a solid line for and shade above.
-
For , draw the line and shade below.
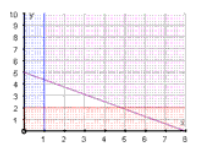
- The solution is the region where all shaded areas overlap.
Introduction to Quadratic Inequalities
Quadratic inequalities involve expressions with and can be more challenging than linear inequalities. To solve them effectively, you often need to sketch a graph to visualise the solution.
How to Solve Quadratic Inequalities
- Simplify the inequality by performing algebraic operations on both sides.
- Sketch the graph of the quadratic equation.
- Use the graph to determine which values of satisfy the inequality.
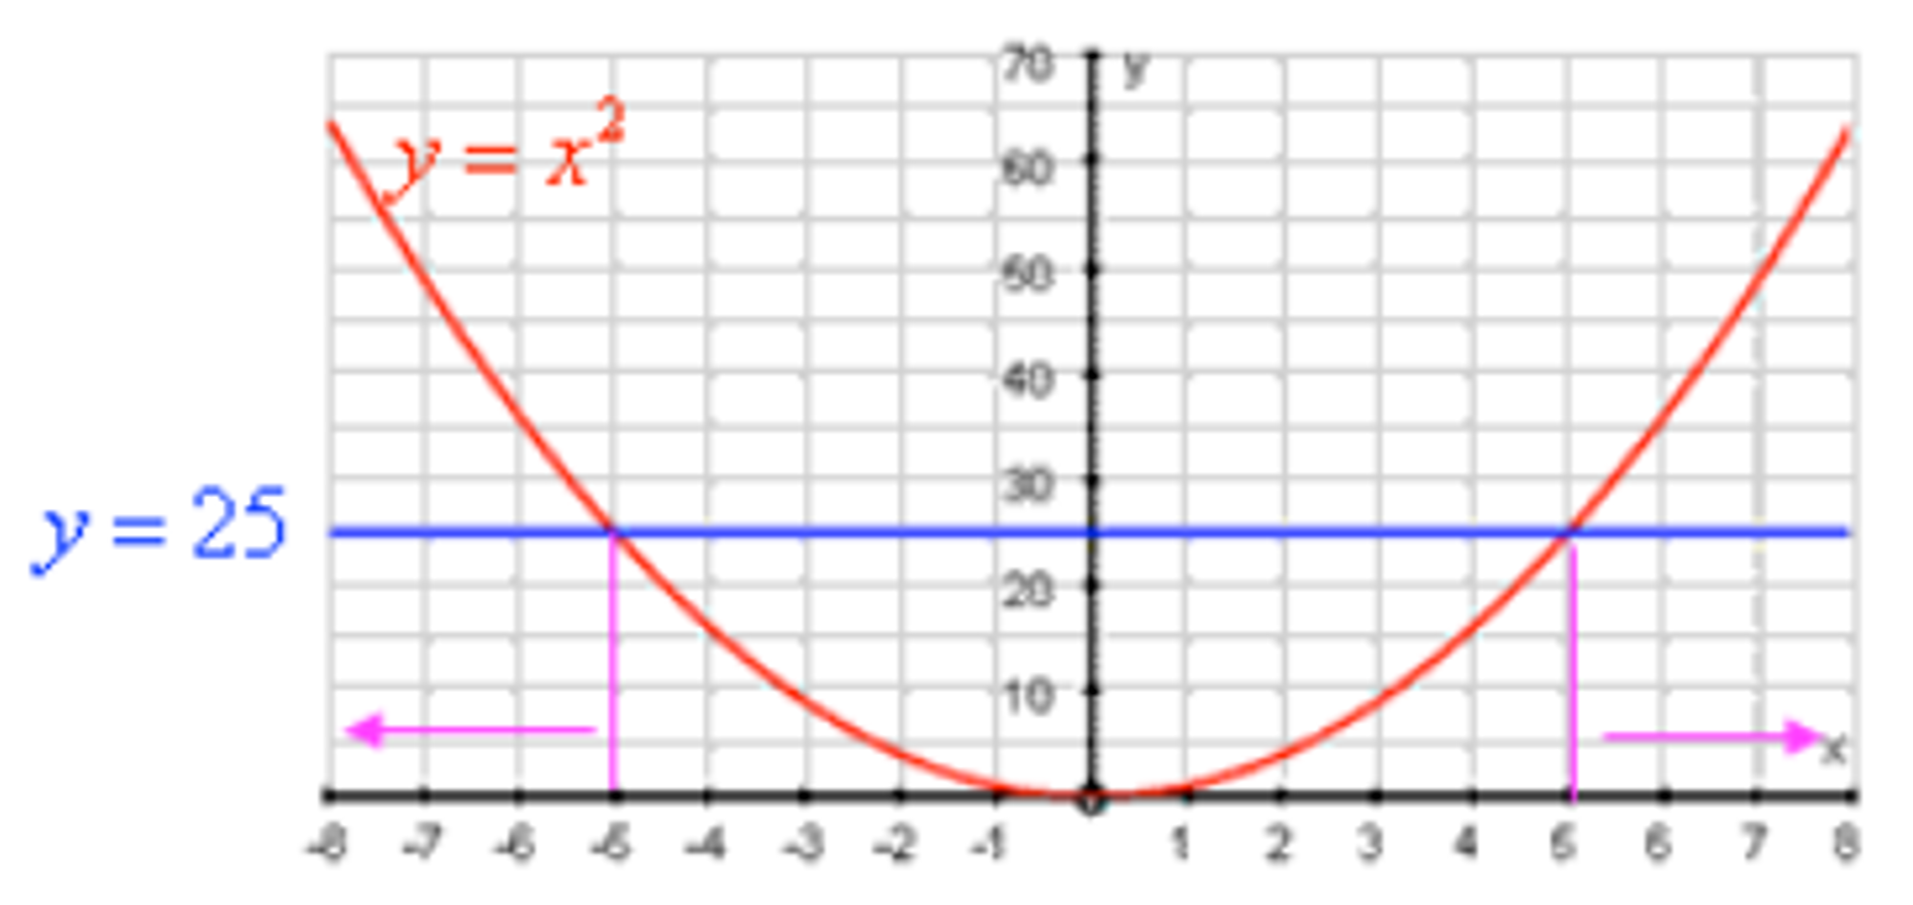
Example: Solve 7. Simplify the inequality:
Subtract from both sides:
Divide by :
- Interpret the inequality:
- We need to find the values of where is greater than or equal to
- Sketch the graph:
- Draw the graph of and the horizontal line .
- The graph shows that when or .
- The inequality holds for values where is either greater than or equal to or less than or equal to .
- Solution:
- From the graph, the solution to the inequality is:
- These are the values of for which is greater than or equal to .