Demand (Junior Cert Business Studies): Revision Notes
Demand
What is demand?
Demand refers to the amount of a product or service that consumers are willing and able to purchase at different price levels during a specific time period. It shows how consumer purchasing behaviour changes as prices change in the marketplace.
Demand is the quantity of a product or service that consumers are prepared to buy at different prices.
Understanding demand helps businesses make decisions about pricing, production levels, and marketing strategies. For example, if Dunnes Stores wants to know how many loaves of bread customers will buy at €2.50 versus €3.00, they're looking at demand patterns.
The law of demand
The law of demand describes a fundamental economic principle that governs how consumers behave in the market. This law states that there is an inverse relationship between the price of a good and the quantity that consumers demand.
When prices rise, people typically buy less of a product because:
- They have limited budgets to spend
- The product becomes less attractive compared to alternatives
- Some consumers may be priced out of the market entirely
When prices fall, people usually buy more because:
- The product becomes more affordable
- New customers enter the market
- Existing customers may purchase additional quantities
The law of demand reflects rational consumer behaviour - people naturally seek to maximise value for their money, purchasing more when prices are lower and less when prices are higher.
For instance, if SuperValu increases the price of their own-brand coffee from €4 to €6, many customers might switch to cheaper alternatives or buy less coffee overall. Conversely, if they reduce the price to €3, more people would likely purchase their coffee.
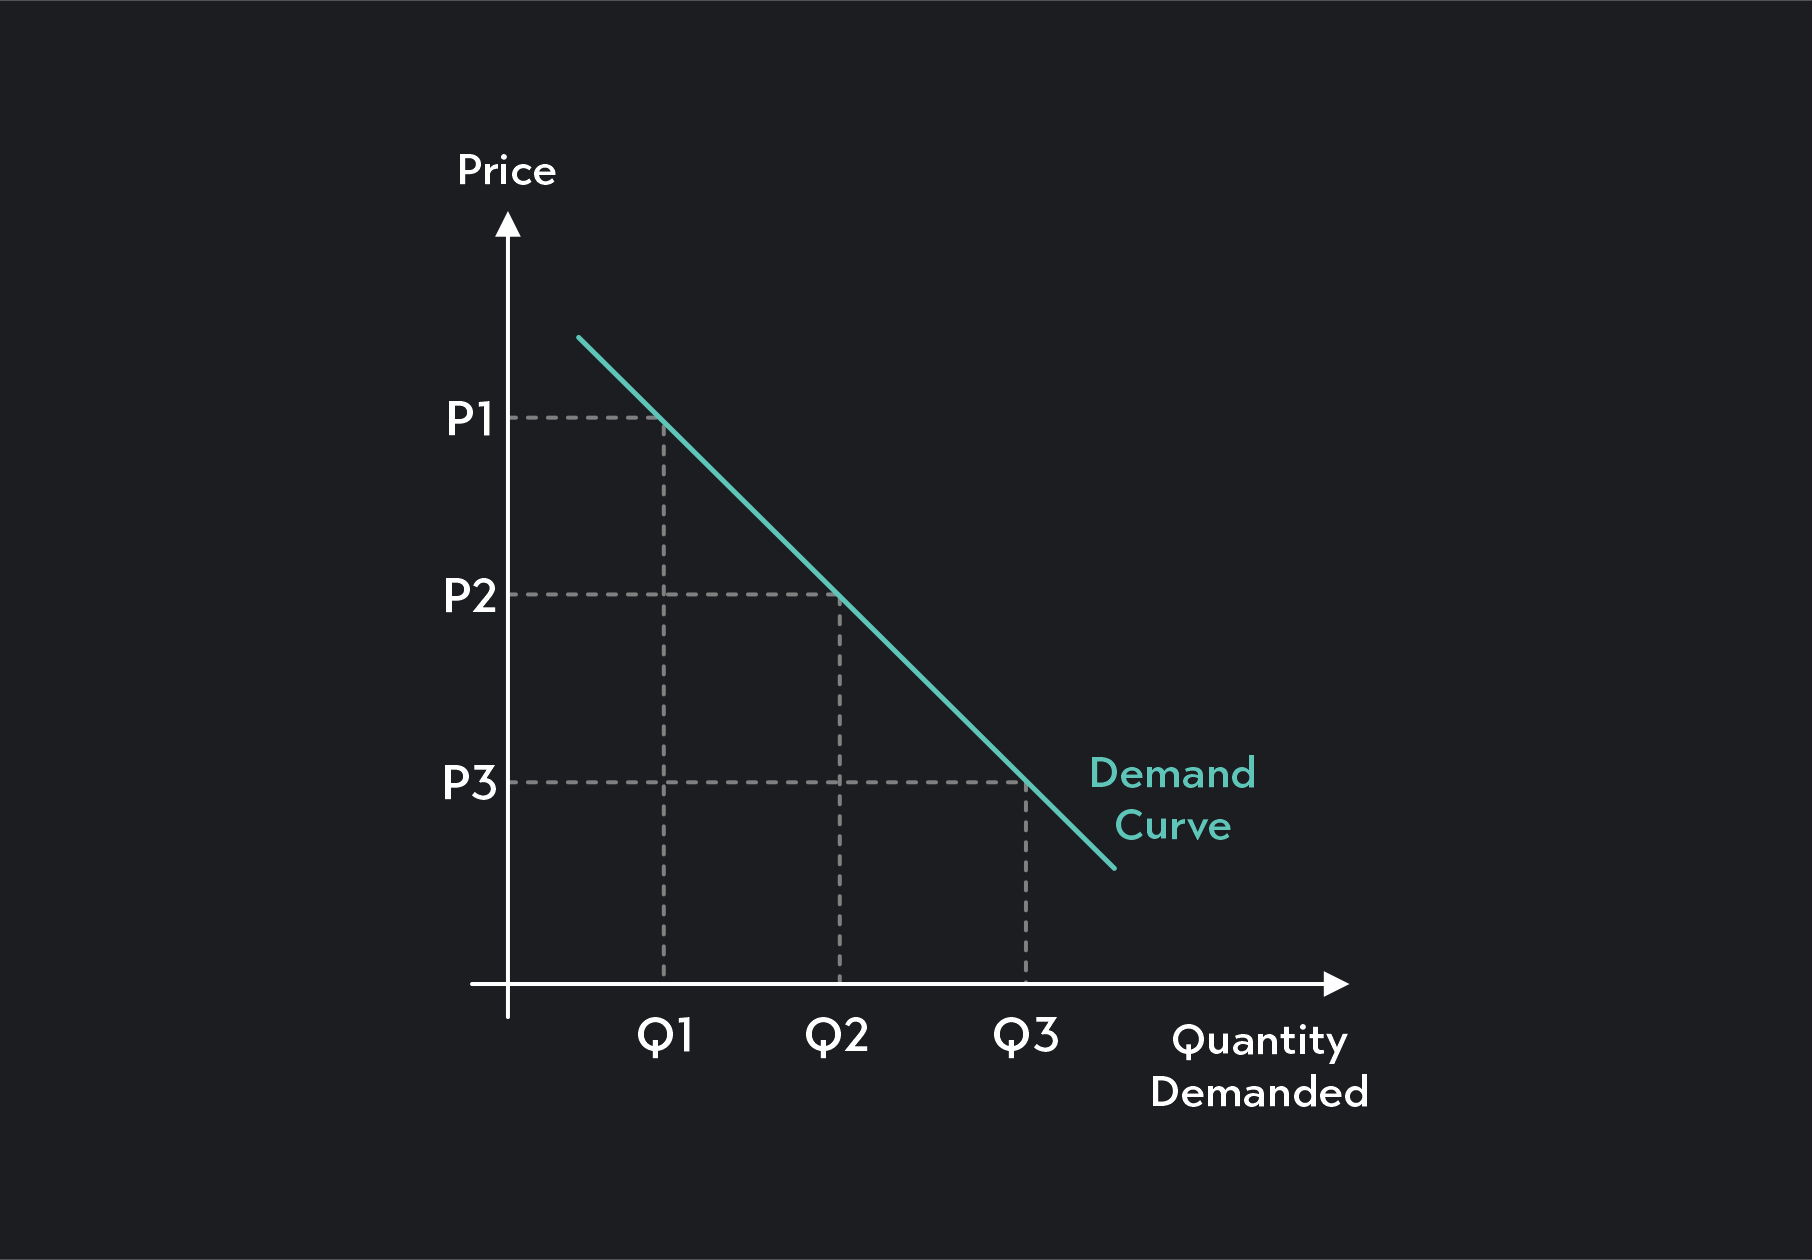
The demand curve
The relationship between price and demand can be shown visually using a demand curve. This is a graph that displays how much of a product consumers will buy at each price level.
Key characteristics of demand curves:
- They slope downward from left to right (negative slope)
- The vertical axis shows price (usually in euros)
- The horizontal axis shows quantity demanded
- Each point on the curve represents a specific price-quantity combination
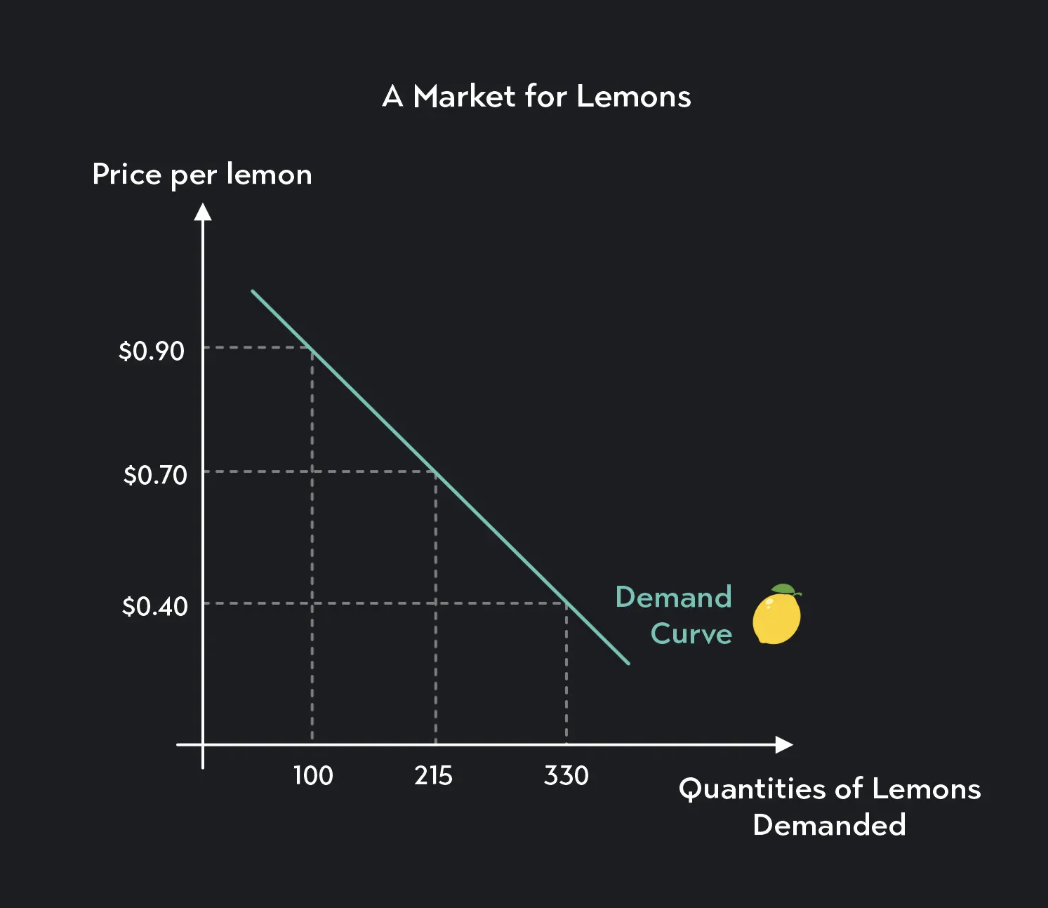
Worked Example: Market for Lemons
Imagine we're looking at demand for lemons in the supermarket:
- At €.40 per lemon: 330 purchases
- At €.70 per lemon: 215 purchases
- At €.90 per ticket: 100 purchases
This data would create a downward-sloping curve, clearly showing how lower prices attract more customers.
Movement along versus shifts in the demand curve
It's crucial to distinguish between two different types of changes in demand patterns:
Movement along the demand curve occurs when only the price of the product changes. The curve itself stays in the same position, but we move to a different point on it. This represents a change in quantity demanded due to price changes alone.
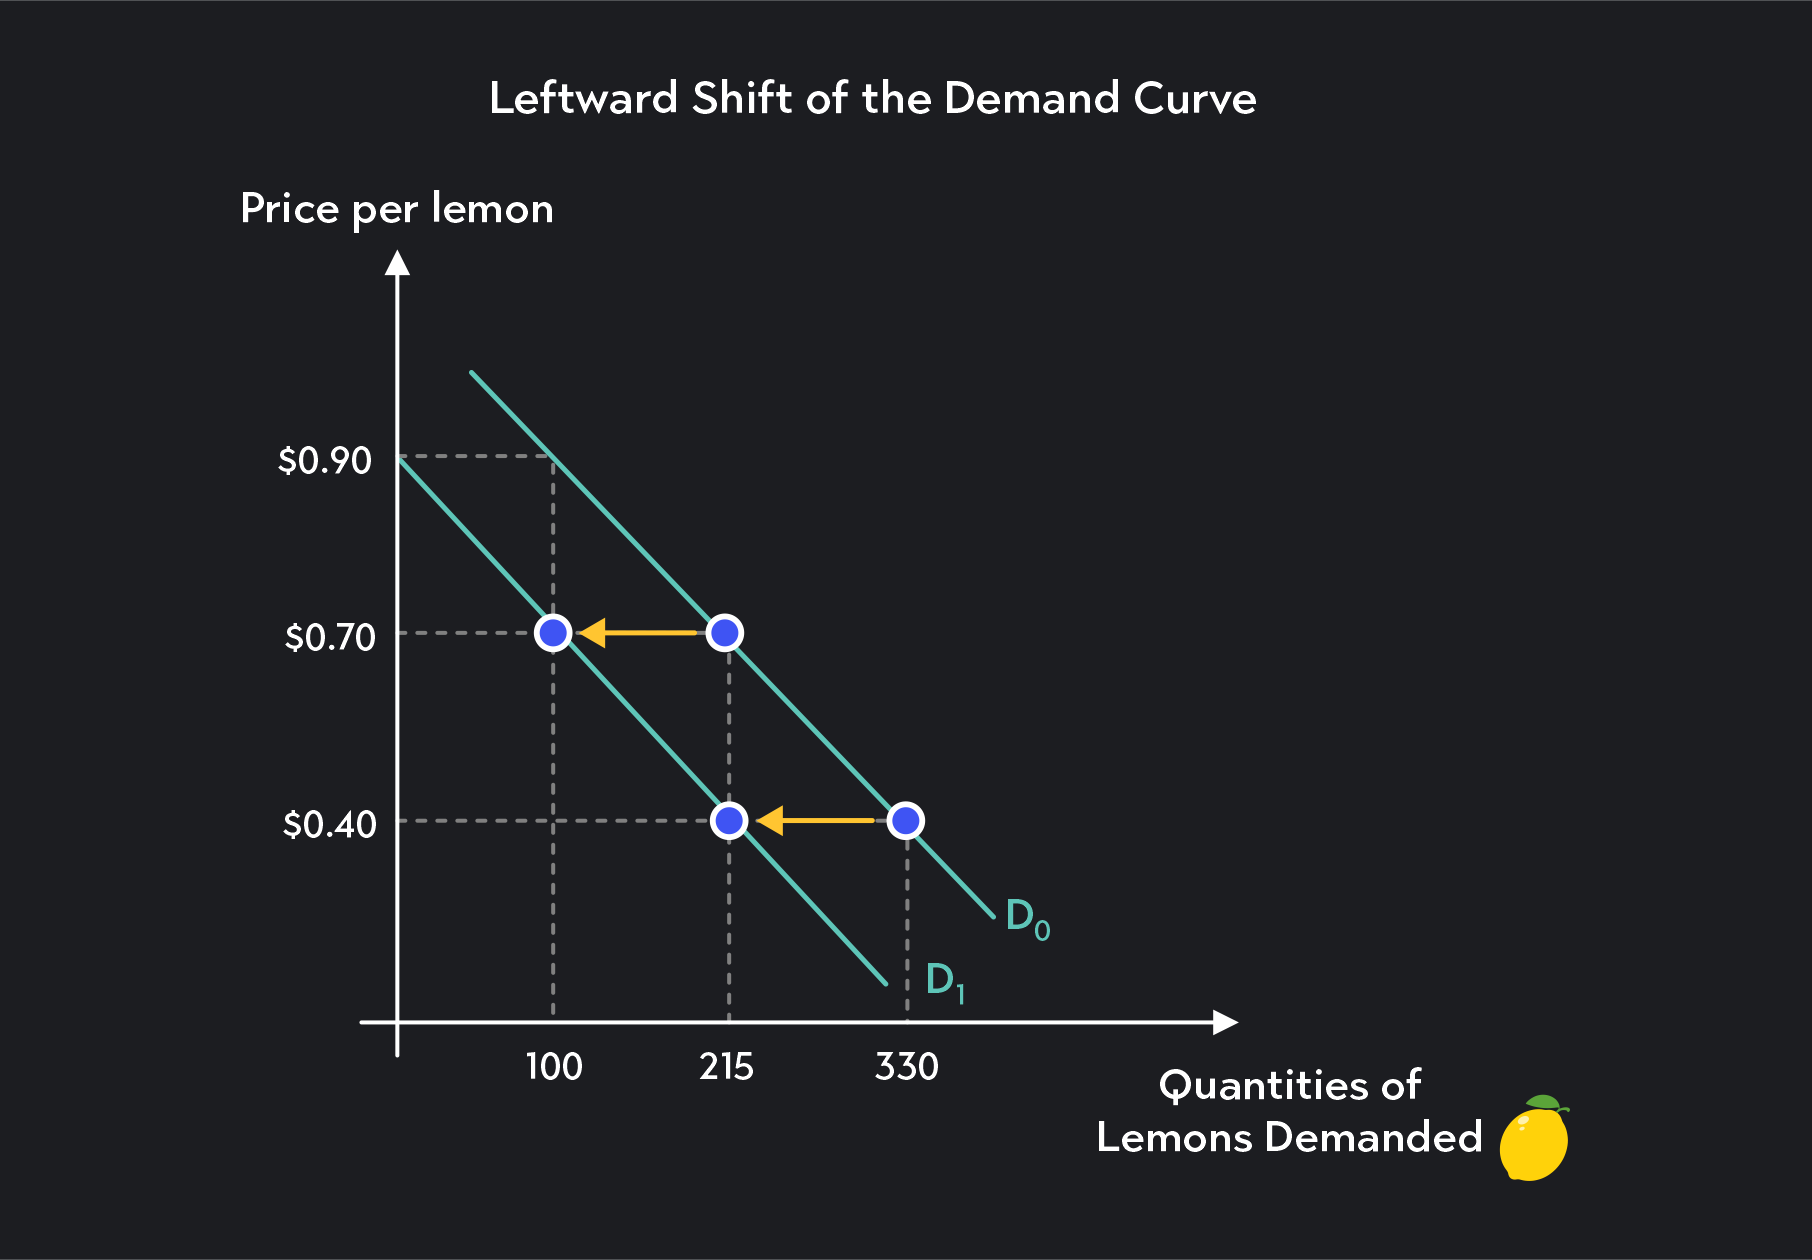
Shifts in the demand curve happen when factors other than price change. The entire curve moves to a new position:
- A shift to the right means demand has increased (more demanded at every price)
- A shift to the left means demand has decreased (less demanded at every price)
Factors that shift the demand curve
Several non-price factors can cause the entire demand curve to shift position:
Income levels
When people's incomes change, their purchasing power changes too. If average household income in Dublin increases, families might buy more restaurant meals, causing the demand curve for dining out to shift right. If unemployment rises and incomes fall, demand for luxury items like expensive electronics would shift left.
Population changes
More people in an area means more potential customers. The opening of a new university campus in Galway would increase the local population of young adults, shifting demand curves to the right for products like coffee, fast food, and textbooks.
Advertising and marketing
Effective advertising campaigns can increase consumer awareness and desire for products. When Tayto launched a major advertising campaign for their crisps, it helped shift their demand curve to the right as more people became interested in buying their products.
Fashion and trends
Consumer preferences change over time. The growing trend towards sustainable living has shifted demand curves to the right for electric vehicles, organic food, and reusable products, while demand for single-use plastics has shifted left.
Prices of substitute goods
When the price of a competing product changes, it affects demand for alternatives. If Coca-Cola raises its prices significantly, demand for Pepsi and other soft drinks would shift to the right as consumers switch brands.
A substitute product is a similar product that can be used in place of another product.
Prices of complementary goods
Some products are consumed together, so changes in one product's price affects demand for its complement. If the price of gaming consoles falls, demand for video games would shift to the right since more people can afford the console.
Complementary goods are goods that are in joint demand. If you buy one, there will be demand for the other.
Examples of complementary goods include:
- Cars and petrol
- Smartphones and phone cases
- Printers and ink cartridges
- Golf clubs and golf balls
Interest rates
When interest rates change, it affects how expensive it is to borrow money. Lower interest rates make it cheaper to get loans, shifting demand to the right for big-ticket items like houses and cars. Higher rates have the opposite effect.
Exceptions to the law of demand
While the law of demand applies to most products, there are some notable exceptions where higher prices don't necessarily reduce demand:
Essential medicines
People with serious medical conditions like diabetes must purchase insulin regardless of price increases. The demand remains relatively stable even when prices rise because there are no substitute products and the need is critical.
Monopoly situations
When only one company provides a service (like Iarnród Éireann for rail transport on many routes), consumers have little choice but to continue purchasing even if prices increase, since no alternatives exist.
In monopoly situations, the normal rules of demand may not apply because consumers lack choice. This is why many essential services are regulated by government to prevent price exploitation.
Luxury and status goods
Some expensive products like designer handbags or luxury cars can actually become more desirable when their prices increase, as the high price enhances their status appeal. This is known as the Veblen effect.
Addictive products
Products that create physical or psychological dependence, such as cigarettes, may see continued demand even when prices rise significantly, as consumers find it difficult to reduce their consumption.
Key Points to Remember:
- Demand shows the relationship between price and quantity - as prices rise, consumers typically buy less
- The demand curve slopes downward - this visual representation makes the inverse price-quantity relationship clear
- Price changes cause movement along the curve - moving to different points on the same curve
- Non-price factors cause the entire curve to shift - income, population, advertising, fashion, and related product prices all matter
- Substitute goods compete with each other - when one becomes more expensive, demand shifts towards alternatives
- Complementary goods work together - changes in one product's price affects demand for products used alongside it