Graphing/Sketching Lines (Junior Cert Mathematics): Revision Notes
Graphing Lines
In this section, we will learn the easiest way to graph a line on the Cartesian Plane. The simplest method is to find where the line crosses the and . These points are called the and . Once you have these two points, you can draw the line that passes through them.
What Are the x-Intercept and y-Intercept?
- : This is the point where the line crosses the . At this point, . The tells us where the line hits the .
- : This is the point where the line crosses the . At this point, . The tells us where the line hits the . By finding these two intercepts, you can easily plot two points on the graph. Then, all you need to do is draw a straight line through these points to complete the graph.
Steps to Graph a Line
Let's go through the steps to graph a line. We will break it down so it's easy to follow.
Step 1: Find the
To find the y-intercept, we substitute into the equation of the line. This is because the is where the line crosses the , and at this point, the is always zero.
Step 2: Find the
To find the x-intercept, we substitute into the equation of the line. This is because the is where the line crosses the , and at this point, the is always zero.
Step 3: Plot the Points
Once you have the and , plot these two points on the graph. These points are where the line crosses the axes.
Step 4: Draw the Line
Finally, draw a straight line through the two points. This line represents the equation you started with.
Worked Example: Graphing a Line
Let's go through an example to see how this works in practice.
Example: Graph the line given by the equation . Step 1: Find the
- To find the , we set because the is where the line crosses the . Substitute into the equation:
Simplify:
To solve for , multiply both sides by :
So, the is at the point . This means the line crosses the at this point.
Step 2: Find the
- To find the , we set because the is where the line crosses the . Substitute into the equation:
Simplify:
To solve for , divide both sides by :
So, the is at the point . This means the line crosses the at this point.
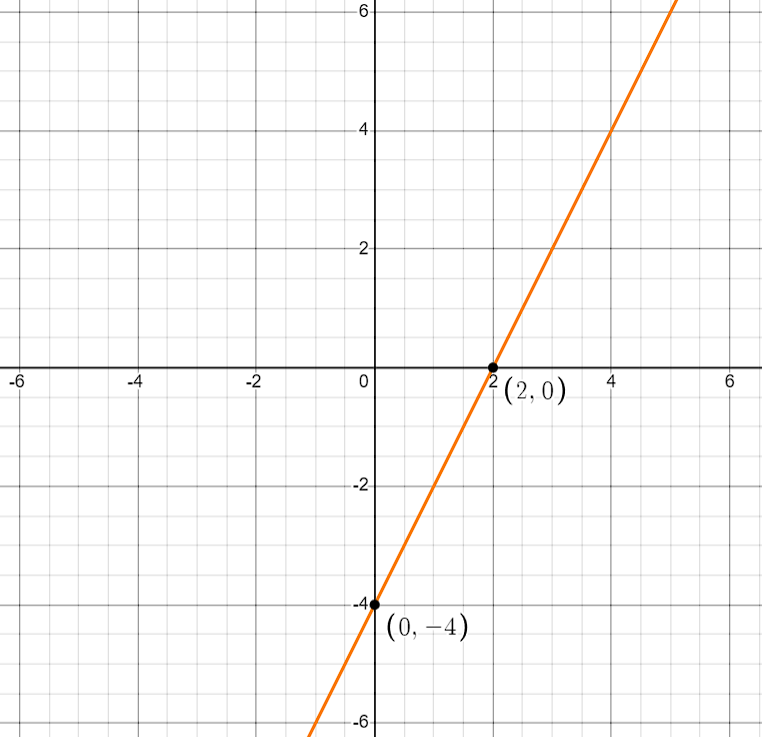
Step 3: Plot the Points
- Plot the points and on the Cartesian Plane. These are the points where the line crosses the axes.
Step 4: Draw the Line
- Draw a straight line through the points and . This is the graph of the equation .
Why This Method Works
By finding the intercepts, you are identifying two key points where the line crosses the axes. Since a line is straight, you only need these two points to draw the entire line. This method is quick, simple, and ensures that your graph is accurate.
Key Tips for Success
- Remember the Basics: To find the y-intercept, set . To find the , set . These are your starting points.
- Plot Carefully: Take your time to accurately plot the intercepts on the graph. This will make your line more precise.
- Use a Ruler: When drawing the line, use a ruler to ensure it's straight. A neat, straight line will help you see the graph clearly. By practising this method, graphing lines will become easier and more straightforward. This approach is simple but powerful and is a great way to get comfortable with graphing equations.