Combination of Graphs (Junior Cert Mathematics): Revision Notes
Combinations of Graphs
In Junior Cycle Maths, you'll often work with two functions together. This might involve finding where the functions are equal (where their graphs cross) or figuring out where one function is larger or smaller than the other. We'll focus on using graphs to solve these problems because it's a straightforward and visual method.
Finding the Intersection of Two Functions
When two functions intersect, it means they have the same value at certain points. Graphically, this happens where the two graphs cross each other.
Step-by-Step Example: Question: Find the points where the functions and intersect.
- Draw the Graphs:
- Start by sketching the graph of . This is a U-shaped curve (called a parabola) that opens upwards.
- Next, draw the graph of . This is a straight line.
- Identify the Intersection Points:
- Look for the points where the two graphs cross each other. These are the points where both functions have the same value.
- Read the Intersection Points from the Graph:
- From the graph, you'll see that the graphs intersect at two points: and . Answer: The points of intersection are and .
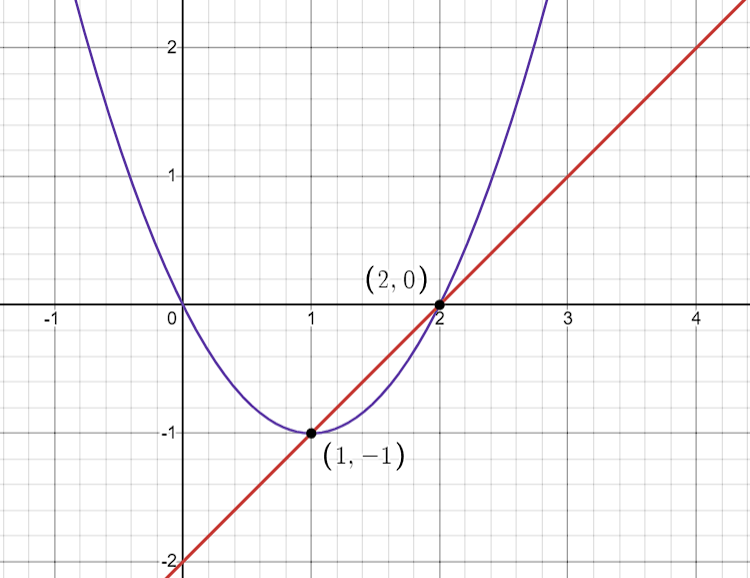
Why This Works: At these points, both functions give the same output (y$$-value) for the same input (x$$-value), which means they intersect on the graph.
Finding Where One Function is Less Than Another
Sometimes, you'll need to find where one function is less than another. Graphically, this means finding the where one graph is below the other.
Step-by-Step Example: Question: Find where is less than .
- Draw the Graphs:
- Start by sketching the graph of. This is another U-shaped curve (parabola) that opens upwards.
- Then, draw the graph of . This is a straight line.
- Look for the Overlaps:
- Find the sections where the graph of is below the graph of .
- Identify the x-values:
- The graph of is below the graph of between the points of intersection, which occur at and . Answer: The function is less than for .
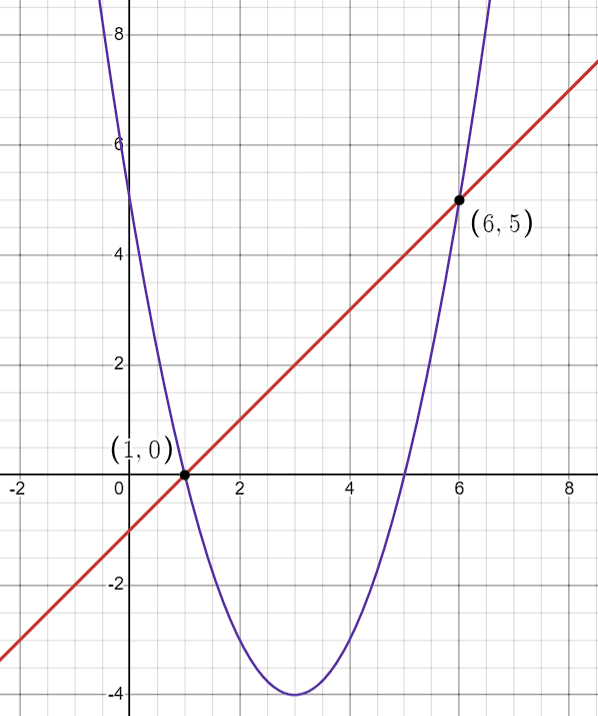
Why This Works: Where the graph of lies below , it means that for those , the outputs of are smaller than the outputs of .
This version uses the functions and , which intersect at and , providing non-decimal intersection points.
Why Graphs Make This Easier:
- Visual Representation: Seeing the graphs helps you understand the relationship between the functions better than just working with numbers.
- Easy to Compare: By looking at the graphs, you can quickly spot where they intersect or where one is above or below the other.
Tips for Success:
- Draw Neatly: Use graph paper to ensure your graphs are accurate.
- Label Everything: Clearly label your x-axis, y-axis, and any important points (like intersections).
- Double-Check: Make sure your graphs are correctly drawn before you make conclusions about where they intersect or overlap. By using graphs to solve problems with combinations of functions, you'll find it easier to understand how the functions relate to each other. Keep practising, and remember that every time you draw a graph, you're creating a visual tool that helps you solve the problem!