Interpreting Graphs (Junior Cert Mathematics): Revision Notes
Interpreting Graphs
Interpreting graphs is about understanding what the graph shows and using that information to answer questions. This skill is important in Junior Cycle Maths, as it helps you solve equations, find maximum and minimum points, and understand how a function behaves.
Solving the Equation
When you see , it means you're looking for the points where the graph crosses the -. These points are called the roots of the equation. They show the values of that make the function equal to zero.
Example: Question: Solve using the graph.
- Look at the graph of the function .
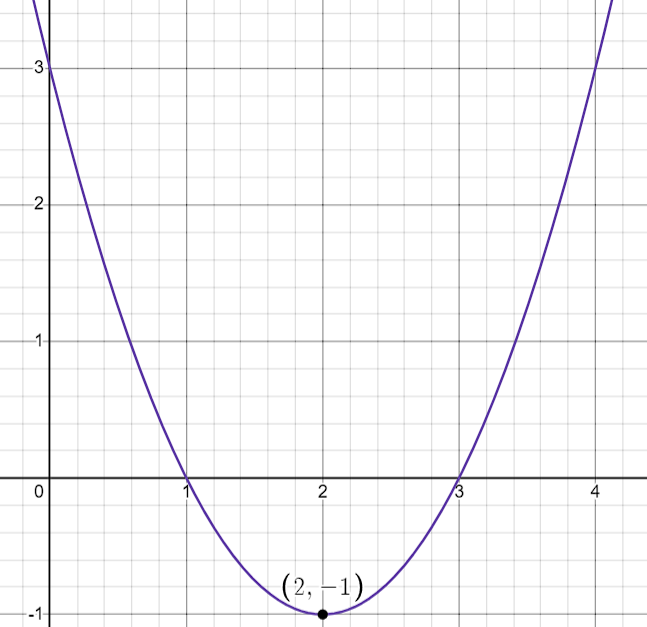
- Find the points where the curve crosses the . These are the points where
- The graph crosses the at and .
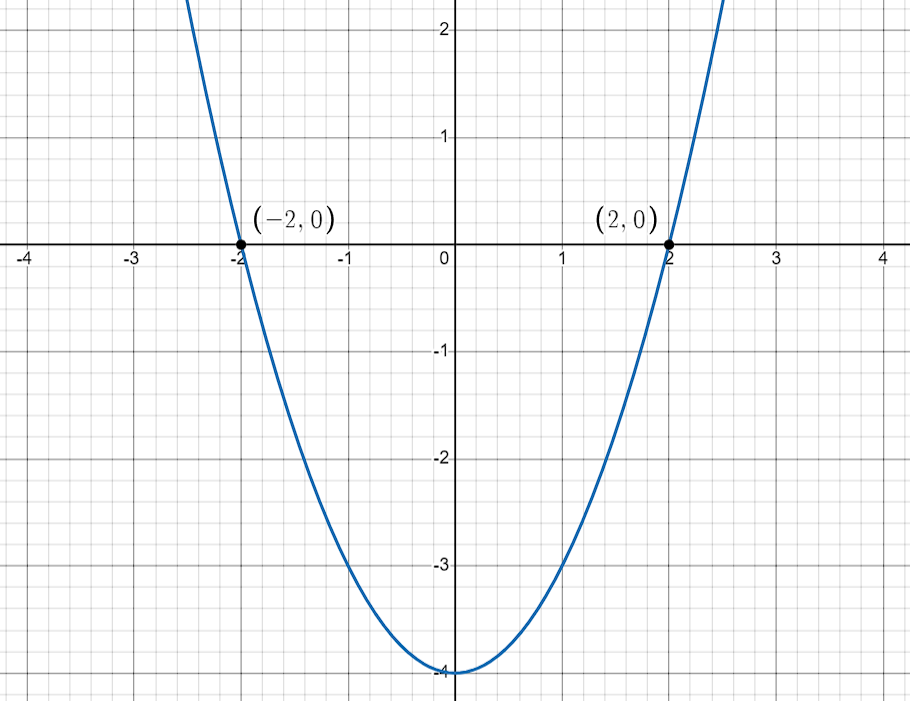
Answer: The solutions to the equation are and .
Explanation: These are the that make the function . At these points, the curve touches the .
Solving the Equation
When you're asked to solve , this means finding the where the graph reaches a particular height, . You do this by drawing a horizontal line at and seeing where it intersects the graph.
Example: Question: Solve for the graph .
- Draw the graph of .
- Draw a horizontal line at (since we're solving .
- Find the points where this line touches the curve.
- The graph intersects the line at and .
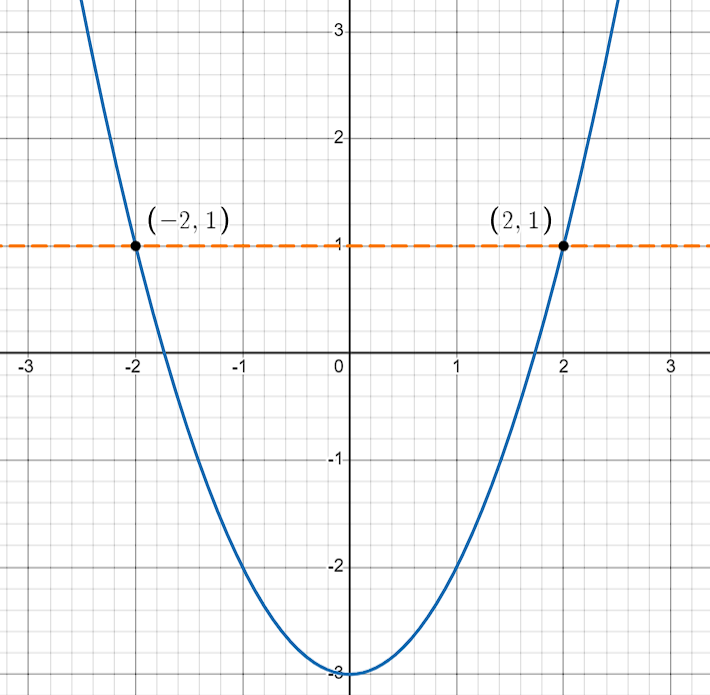
Answer: The solutions to the equation are and .
Explanation: These give a of when plugged into the function.
When is a Function Negative?
A function is negative when its graph is below the . This means the (outputs) are less than zero.
Example: Question: For what values of is the function negative?
- Look at the graph of .
- Identify the parts of the graph that are below the .
- The graph is below the x-axis between and .
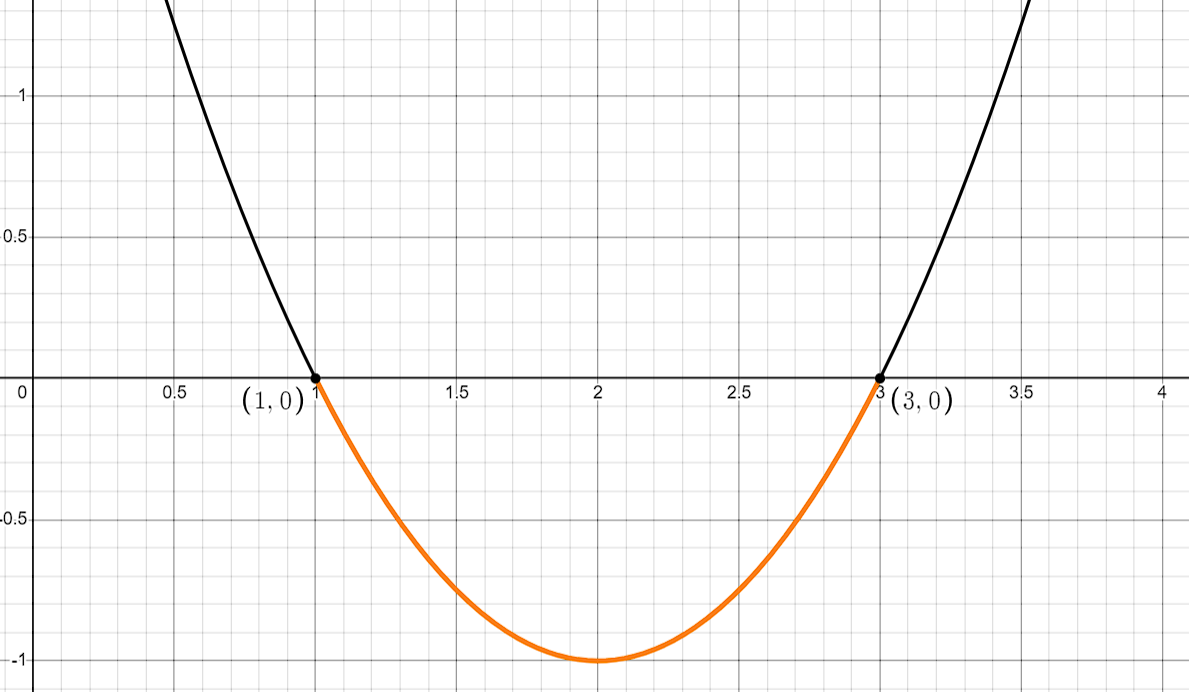
Answer: The function is negative for .
Explanation: Between these , the curve is below the , meaning the are negative.
Finding from a Graph
To find , you locate the on the graph and read the corresponding .
Example: Question: Find for the graph .
- Locate on the .
- Find where the vertical line at intersects the graph.
- The at this point is .
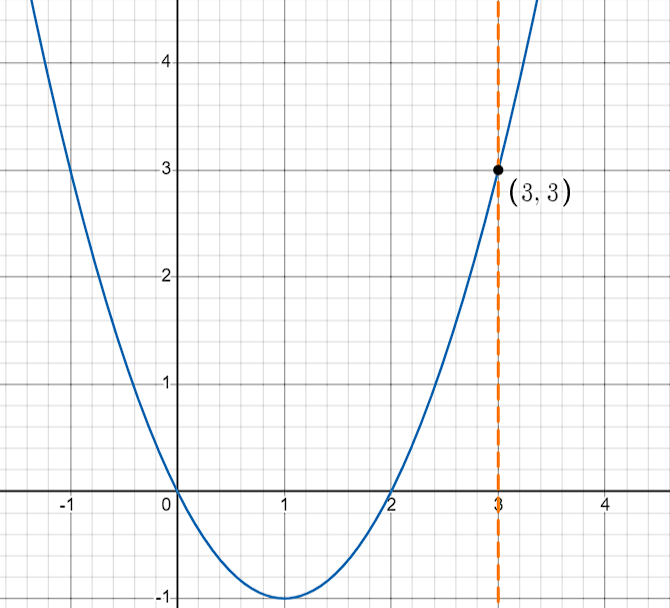
Answer: .
Explanation: When you input into the function, the output ( is .
When is a Function Increasing or Decreasing?
A function is increasing when its graph goes up as you move from left to right and decreasing when the graph goes down.
Example: Question: When is the function increasing or decreasing?
- Look at the graph. Identify where it goes up (increasing) and where it goes down (decreasing).
- The graph decreases for and increases for .
Answer: The function is decreasing when and increasing when .
Explanation: The curve goes down before reaching , and then it starts going up after that.
Tips for Success:
- Draw the Graph: Always start by drawing or looking at the graph.
- Label Everything: Clearly label the , , and important points.
- Check Your Work: Double-check where the graph crosses the axes or reaches its highest/lowest points.
- Practice: The more you practice, the easier it will become to interpret graphs quickly. By understanding these steps and practising regularly, you'll get better at interpreting graphs and answering related questions on your Junior Cycle Maths exam. Don't hesitate to ask questions if you find something difficult—practice makes perfect!