Linear: y=ax + b (Junior Cert Mathematics): Revision Notes
Linear Functions
What is a Linear Function?
A linear function is a type of mathematical function that creates a straight line when graphed on a coordinate plane. The standard form of a linear function is:
Where:
- is the output or the y$$-value (sometimes written as ).
- is the input or the x$$-value.
- is the slope of the line, which tells us how steep the line is.
- is the y-intercept, which is the point where the line crosses the .
Tip: If you've studied coordinate geometry, you'll recognise that linear functions are closely linked to the equations of lines. The slope is the same as the slope you calculate in coordinate geometry, and the equation represents a straight line on a graph, just like in coordinate geometry!
Why Are They Called Linear Functions?
Linear functions are called "linear" because they graph as straight lines. To plot a function on a graph, we place the input values on the x$$-axis (horizontal axis) and the corresponding output values on the y$$-axis (vertical axis). When you plot different points of the function on a graph and then connect them, you will get a straight line.
For example, consider the function:
This function can be thought of as a rule that takes any value of and adds to it to give the corresponding value.
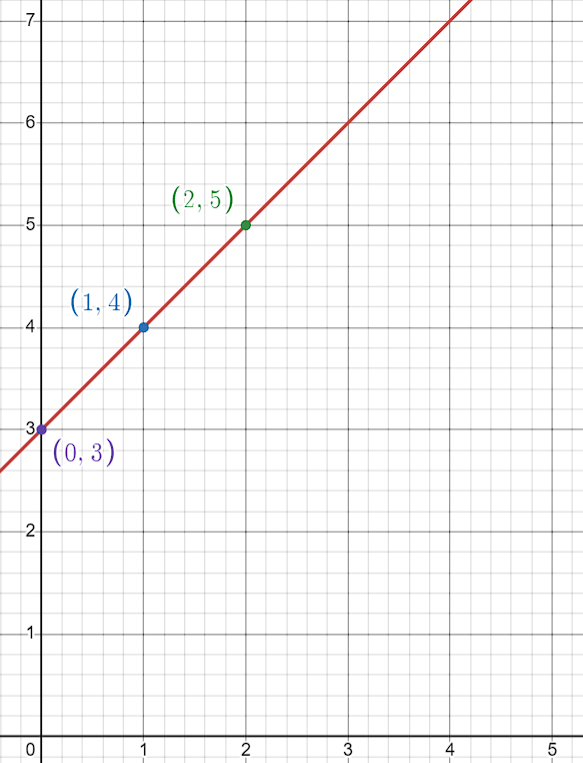
- If , then .
- If , then .
- If , then . These points form a straight line when plotted on a graph. The function is shown in red on the graph below:
Plotting a Linear Function
To plot a linear function on a graph, follow these steps:
- Choose a value for (this is your input value). It's a good idea to pick a few different values to get a more accurate graph.
- Calculate the corresponding value using the function (this is your output value).
- Plot the points on the graph. Remember that the x $$-value goes on the horizontal axis (x$$-axis) and the y $$-value goes on the vertical axis (y$$-axis).
- Connect the points with a straight line. This line represents the linear function.
Let's use the example :
- If , , so plot the point .
- If , , so plot the point
- If , , so plot the point .
Once you've plotted these points, draw a straight line through them to represent the function. The line extends infinitely in both directions, showing all possible points for the function.
Summary
- A linear function creates a straight line when graphed.
- The function can be written as .
- You can graph a linear function by plotting points.
- The x$$-axis represents the input values, and the y$$-axis represents the output values.