Stem & Leaf Plots (Junior Cert Mathematics): Revision Notes
Stem and Leaf Plots
A stem and leaf plot is a way to organise and display numerical data in a form that allows you to see the distribution of the data. It splits each number in the data set into two parts: the "" (typically the leading digit(s)) and the "" (usually the last digit). This type of plot is particularly useful for quickly identifying the shape of the data distribution, spotting outliers, and comparing different sets of data.
Think of it like this: If you have a list of numbers, a stem and leaf plot helps you sort them in a way that makes it easy to see patterns and compare values.
Why Use Stem and Leaf Plots?
Stem and leaf plots are useful because:
- They Show All Data Points: Unlike other graphs, they display every data point, so you don't lose any information.
- They Help Spot Patterns: You can quickly see where most of the data falls, making it easier to identify trends or clusters.
- They Allow Comparisons: When using back-to-back stem and leaf plots, you can easily compare two sets of data side by side.
Parts of a Stem and Leaf Plot
Here's what you'll find in a stem and leaf plot:
- Stem: The stem is the first part of each number, representing the broader category or range. For example, in the number , the stem would be .
- Leaf: The leaf is the last digit of each number, showing the finer details. In the number , the leaf would be .
- Key: A key is included to explain how to read the plot. For instance, means that a stem of and a leaf of together make the number .
How to Read a Stem and Leaf Plot
Reading a stem and leaf plot involves a few simple steps:
- Look at the Stems: These are usually listed on the left side and represent the larger groups or ranges in your data.
- Look at the Leaves: The leaves are aligned to the right of each stem, representing the smaller increments within each group.
- Combine the Stem and Leaf: By putting the stem and leaf together, you can see the actual numbers in the data set.
Making a Stem and Leaf Plot
Creating a stem and leaf plot involves organising your data into a structured format:
- List Your Data: Start by writing down all the numbers in your data set in order, from smallest to largest.
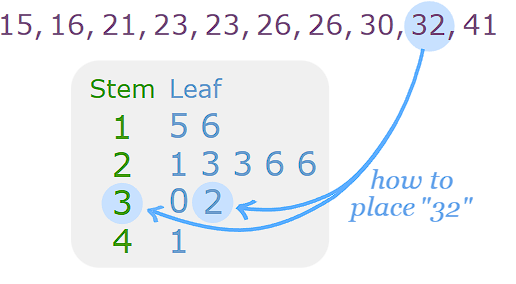
- Split Each Number: Separate each number into a stem and a leaf. The stem typically includes all digits except the last one, which becomes the leaf.
- Draw the Plot:
- Write down the stems in a vertical column on the left.
- List each leaf to the right of its corresponding stem, in order.
- Include a Key: Always add a key to explain how to read the plot, so it's clear how the stems and leaves combine to form the numbers.
Calculating the Median Using a Stem and Leaf Plot
Finding the Median:
- Order the Data: Ensure that the data in the stem and leaf plot is in numerical order.
- Count the Data Points: Find the total number of data points.
- Identify the Middle: The median is the middle value. If there is an odd number of data points, the median is the exact middle one. If there is an even number, the median is the average of the two middle numbers.
Conclusion
Stem and leaf plots, including back-to-back stem and leaf plots, are valuable tools for organising and interpreting data. They allow you to display all data points clearly, spot patterns, and compare two data sets side by side. Knowing how to create and interpret these plots, as well as how to calculate the median and range, will help you better understand the data you're working with.