Drawing and Interpreting Graphs in Science (Junior Cert Science): Revision Notes
Drawing and Interpreting Graphs in Science
Graphs are powerful tools in science that help us understand data quickly and clearly. When you look at a graph, you can spot patterns and relationships much faster than reading through tables of numbers. This revision note will teach you how to draw graphs correctly and how to interpret the information they contain.
What is a graph and why do we use them?
A graph is a visual way of showing data. Instead of presenting information in rows and columns like a table, graphs use lines, points, and shapes to display patterns and trends. Scientists use graphs because they make it much easier to see relationships between different pieces of information at a glance.
Consider an example from the COVID-19 pandemic. The table below shows the number of diagnosed cases over a six-month period:
| Month | Number of COVID-19 cases diagnosed |
|---|---|
| May | 100 |
| June | 180 |
| July | 290 |
| August | 440 |
| September | 260 |
| October | 100 |
When this same information is shown as a graph, the pattern becomes much clearer:
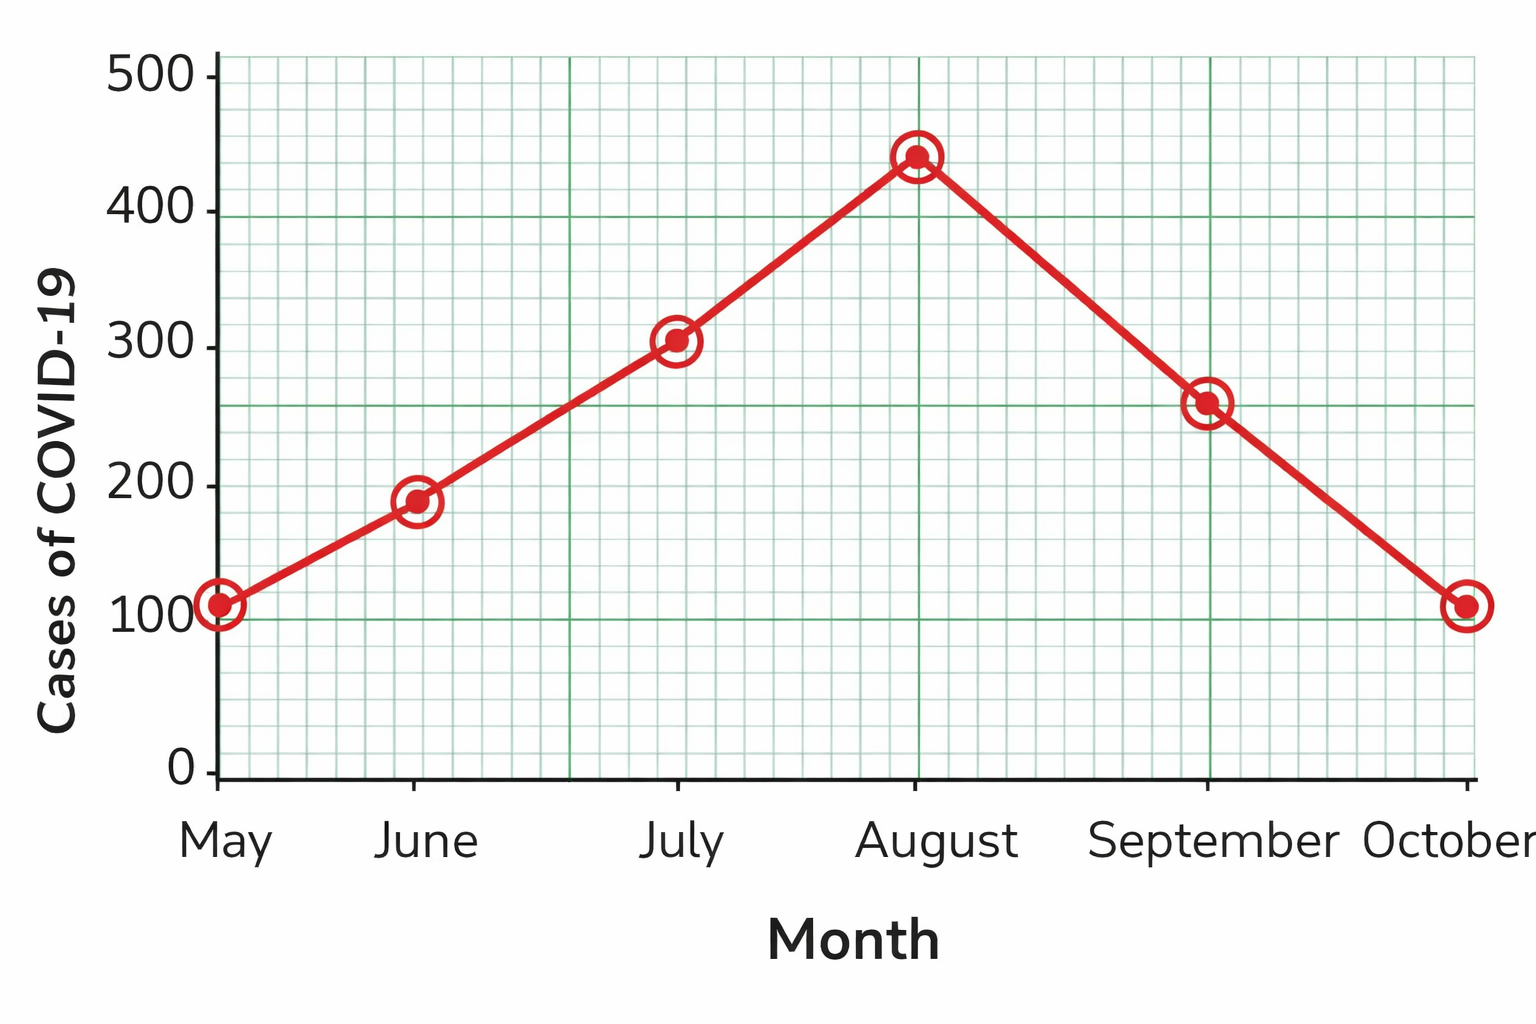
From the graph, you can immediately see that cases increased from May through to August, peaked in August, and then declined through September and October. This trend would take much longer to identify by just looking at the numbers in the table. This demonstrates why graphs are such powerful tools for understanding data patterns.
Understanding graph terminology
Before you start drawing graphs, you need to understand some important terms:
The x-axis is the horizontal line that runs along the bottom of the graph. Data can be shown here either as a number line or as a position along the axis where items are equally spaced.
The y-axis is the vertical line that runs up the side of the graph. Data on the y-axis are usually shown as a number line, where the numbers are equally spaced. This is called scaling.
The origin is the point where the two axes meet, usually at the bottom left corner of the graph.
Scaling refers to how you space the numbers on your axes. The numbers should be evenly distributed to create an accurate picture of your data.
How to draw a simple graph
Drawing a graph accurately requires careful attention to detail. You will need graph paper, a ruler, and a pencil. Here are the essential steps:
Step 1: Draw your axes
Use a ruler to draw the x-axis (horizontal) and y-axis (vertical) at the edges of a large box on your graph paper. Make sure your lines are straight and meet at right angles.
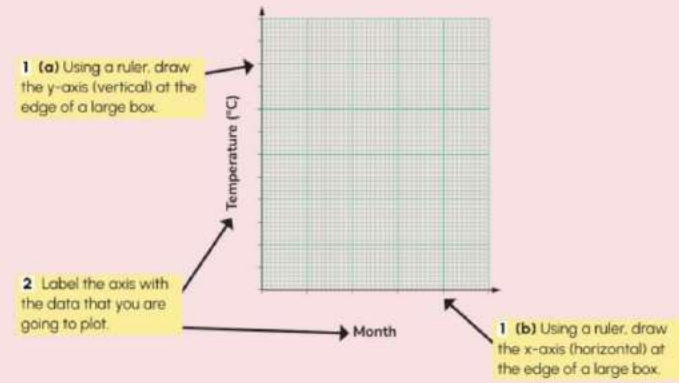
Step 2: Label your axes
Each axis needs a label that tells the reader what data it shows. Labels should include the unit of measurement in brackets. For example, "Temperature (°C)" or "Time (hours)".
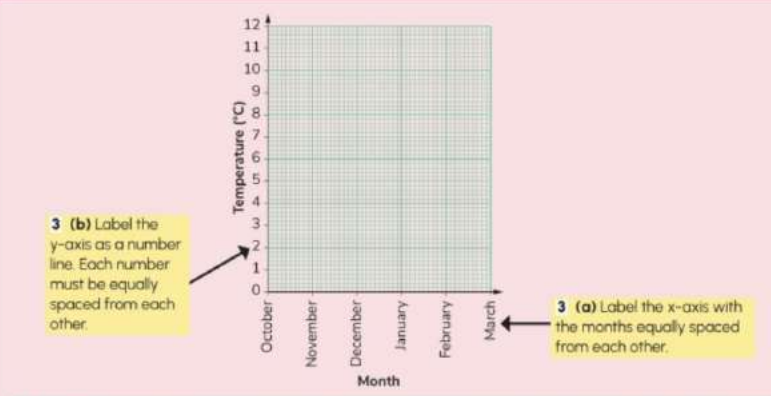
Step 3: Add a scale to your axes
You need to work out an appropriate scale for each axis. The scale should:
- Fill at least half of the available space on the graph
- Have numbers that are equally spaced
- Use sensible intervals (like , , , not awkward numbers like or )
Look at your data to find the largest and smallest values before choosing your scale. This helps you choose a scale that fits all your data points comfortably on the graph and uses the available space effectively.
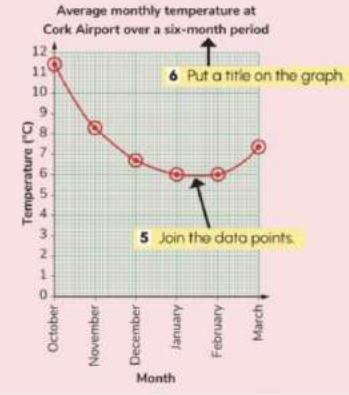
Step 4: Plot your data points
Mark each data point with a small dot, then draw a small circle around it. This makes the points easy to see and check.
Step 5: Join the points
If the points can be joined by one straight line, use a ruler to connect them. If not, draw a smooth curve or connect them as accurately as you can. Some graphs may show individual points that shouldn't be joined at all.
Step 6: Add a title
Every graph needs a clear title that explains what the graph shows. The title should be specific and informative.
Drawing advanced graphs with numeric data on both axes
Some investigations produce data where both axes show numeric measurements. For example, you might measure how the bounce height of a squash ball changes at different temperatures. In these cases, you need to pay extra attention to the scaling on both axes.
Understanding the line of best fit
When you plot experimental data, your points might not all fall perfectly on a straight line. This is normal—real-world measurements always have some variation. Instead of connecting every point, you should draw a line of best fit.
A line of best fit is a straight line or smooth curve that passes as close as possible to most of your data points. To draw it:
- Use a transparent ruler so you can see all your points
- Position the ruler so that roughly equal numbers of points fall on each side of the line
- The line should pass through two points if possible, but this isn't always necessary
- Ignore any obvious outliers when drawing your line
When drawing a line of best fit, don't try to connect every single point. The goal is to show the general trend of the data, not to pass through every measurement. It's perfectly normal for some points to be slightly above or below the line.
Good distribution of points
When plotting data, aim for a good distribution of points. This means:
- Points are spread across the graph, not all bunched together
- There are roughly equal numbers of data points to the left and right of the line
- The points show the overall pattern clearly
Identifying outliers
An outlier (also called anomalous data) is a point that doesn't fit the general pattern. It appears far away from the line of best fit and the other points. Outliers might result from measurement errors or unusual conditions during the experiment. When you spot an outlier, you should:
- Check if you plotted it correctly
- Consider whether there was an error in the measurement
- Not include it when drawing your line of best fit
- Make a note of it in your analysis
Common Mistake to Avoid: Don't automatically discard data points just because they don't fit perfectly on your line. Only treat a point as an outlier if it is significantly far from the general pattern shown by the other points. Some variation is normal and expected in experimental data.
Interpreting graphs to extract information
Reading and understanding graphs is just as important as drawing them. Graphs can reveal patterns, trends, and relationships that help answer scientific questions.
Reading trends over time
Consider this graph showing life expectancy over years:
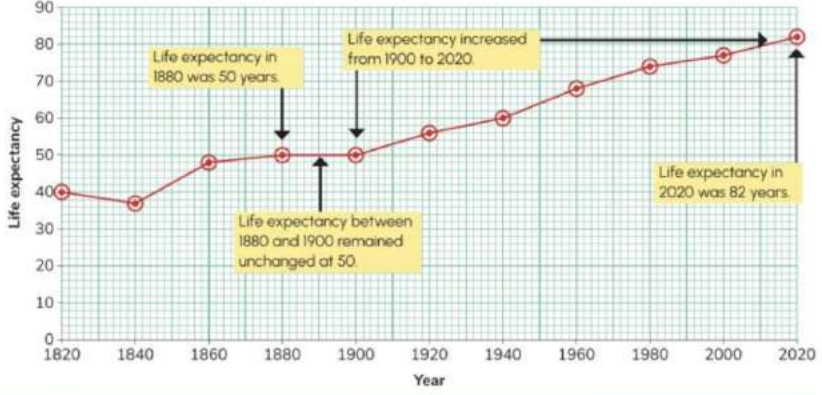
From this graph, you can read several pieces of information:
- In , life expectancy was around years
- Between and , life expectancy remained fairly constant at about years
- By , life expectancy had increased dramatically to years
- The overall trend shows a steady increase, especially from onwards
When describing trends from graphs, always use specific values to support your observations. Don't just say "life expectancy increased"—give the actual numbers from the graph, such as "increased from years in to years in ."
Understanding proportionality
Some graphs show a special relationship called proportionality. A graph shows proportionality when it is a straight line that passes through the origin (the point where both axes equal zero).
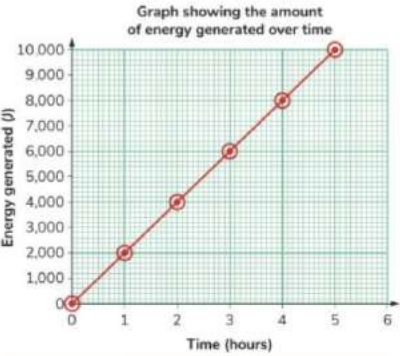
This graph shows energy generated over time. Notice that:
- The line is perfectly straight
- It passes through the origin ()
- When time doubles, energy generated also doubles
This tells us that energy generated is directly proportional to time. We can say that as time increases, the amount of energy generated also increases by the same proportion.
Key Feature of Proportionality: For a relationship to be truly proportional, the graph MUST be both:
- A straight line, AND
- Pass through the origin ()
If either of these conditions is not met, the relationship is NOT proportional, even if the line is straight.
Using graphs as a source of data
Graphs don't just show general patterns—you can also use them to read specific values, even for points that weren't in your original data.
Reading values from a graph
Look at this graph showing sea depth over time:
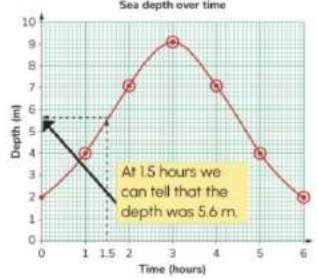
To find the depth at hours:
- Find hours on the x-axis
- Draw a vertical line up to the graph line
- From that point, draw a horizontal line across to the y-axis
- Read the value: approximately metres
You can also use graphs to answer questions about ranges of values. For example:
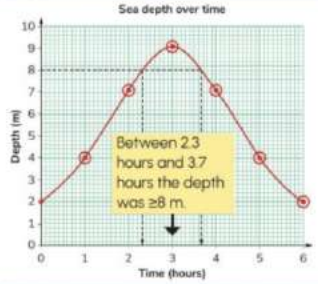
To find how long the depth was metres or greater, you would:
- Draw a horizontal line at metres on the y-axis
- See where this line crosses the graph
- Draw vertical lines down to the x-axis from these crossing points
- Calculate the time difference between these points
Exam Tip: When reading values from a graph, always use a ruler to draw straight lines to the axes. Never estimate by eye, as this leads to inaccurate readings. In an exam, examiners may award marks for showing these construction lines on the graph.
Avoiding common mistakes
When using graphs as a data source:
- Do not erase the construction lines you draw—they show the examiner your working
- Use a sharp pencil for accuracy
- Double-check which axis shows which variable
- Pay attention to the units on each axis
- Read the scale carefully, especially if each square represents more than one unit
Always check the scale on both axes carefully. A common mistake is assuming each grid square represents one unit, when it might actually represent , , or even units. This can lead to reading completely incorrect values from the graph.
Remember!
Key Points to Remember:
- A graph is a visual representation of data that makes patterns and trends easier to see than tables of numbers
- The x-axis is horizontal and the y-axis is vertical
- Always label your axes with the variable name and unit of measurement
- Choose a sensible scale that uses at least half the available graph space
- A line of best fit shows the general trend of the data, passing close to most points
- Outliers are points that don't fit the pattern and should be noted but not included in the line of best fit
- Proportional relationships appear as straight lines through the origin
- You can read specific values from a graph by drawing construction lines from the axes