Terminology (Leaving Cert Applied Maths): Revision Notes
Terminology
Graph theory is a fascinating area of mathematics that helps us understand networks and connections. Think of it like mapping friendships on social media or finding the best routes between cities. Let's explore the essential terminology you need to know.
Basic components of graphs
A graph is essentially a mathematical way of showing relationships between different objects. It consists of two main parts that work together to create these visual representations.
Vertices and nodes are the fundamental building blocks of any graph. These are simply points or dots that represent the objects we're studying. Whether you call them vertices or nodes doesn't matter - they're the same thing! Think of them as cities on a map or people in a social network.
Edges and arcs are the connections between vertices. These are the lines that join vertices together, showing that there's some kind of relationship between them. Like roads connecting cities or friendships linking people together.
The terms "vertices" and "nodes" are completely interchangeable, as are "edges" and "arcs." Different textbooks and applications may prefer one term over another, but they mean exactly the same thing.
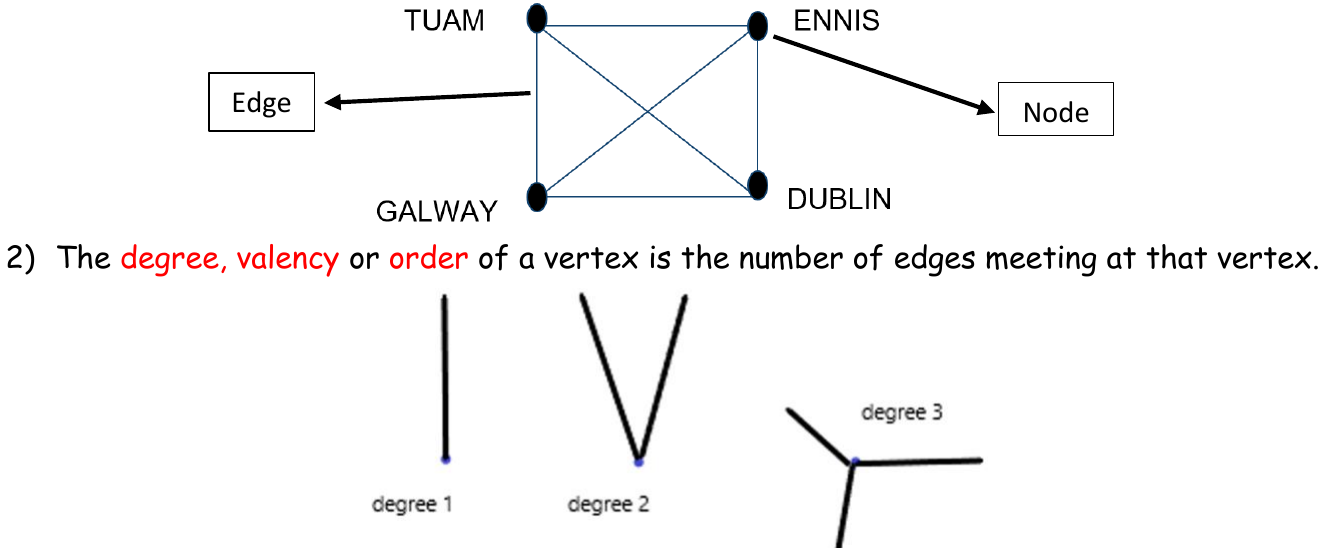
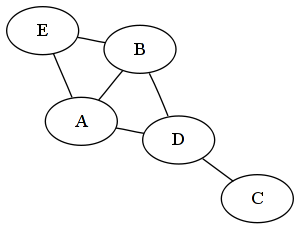
This diagram shows how vertices (the Irish cities) are connected by edges, creating a network that represents relationships between these locations.
Understanding vertex degree
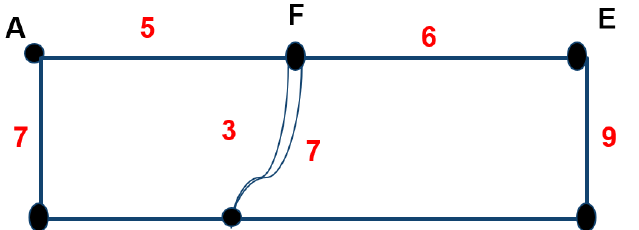
The degree of a vertex (also called valency or order) tells us how many connections that particular vertex has. It's simply the number of edges that meet at that vertex.
Think of vertex degree like counting how many friends someone has on social media - the more connections, the higher the degree. A vertex with degree 1 has just one connection, degree 2 has two connections, and so on.
The concept is crucial because it helps us understand the importance or centrality of different vertices within a network.
Weighted graphs
Sometimes we need more than just knowing whether two vertices are connected - we need to know the strength or cost of that connection. This is where weights come in.
Weights are numerical values assigned to edges. These numbers could represent distances between cities, costs of transportation, or strength of relationships.
Practical Example: Road Network Weights
In a road network connecting different towns:
- Weight = 50 might represent 50 kilometres between Town A and Town B
- Weight = 25 might represent 25 kilometres between Town B and Town C
- Weight = 75 might represent 75 kilometres between Town A and Town C
This helps determine the shortest route for delivery trucks or the most cost-effective transportation path.
Weighted graphs are particularly useful in real-world applications like finding the shortest route for delivery trucks or determining the most cost-effective way to connect different locations.
Directed versus undirected graphs
Graphs can show different types of relationships, and this is where the concept of direction becomes important.
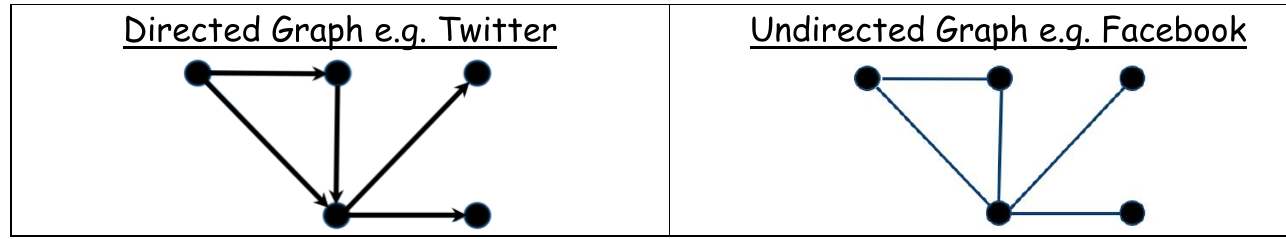
Undirected graphs have edges without arrows, meaning the relationship goes both ways.
Example: Facebook Friendships
In an undirected graph representing Facebook friendships:
- If you're friends with someone, they're automatically friends with you too
- The connection is mutual and bidirectional
- There are no arrows on the edges because the relationship works in both directions
Directed graphs (or digraphs) have edges with arrows showing the direction of the relationship.
Example: Twitter Followers
In a directed graph representing Twitter follows:
- You can follow someone without them following you back
- An arrow points from you to the person you follow
- The relationship has a specific direction and isn't necessarily mutual
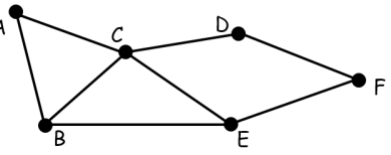
Understanding subgraphs
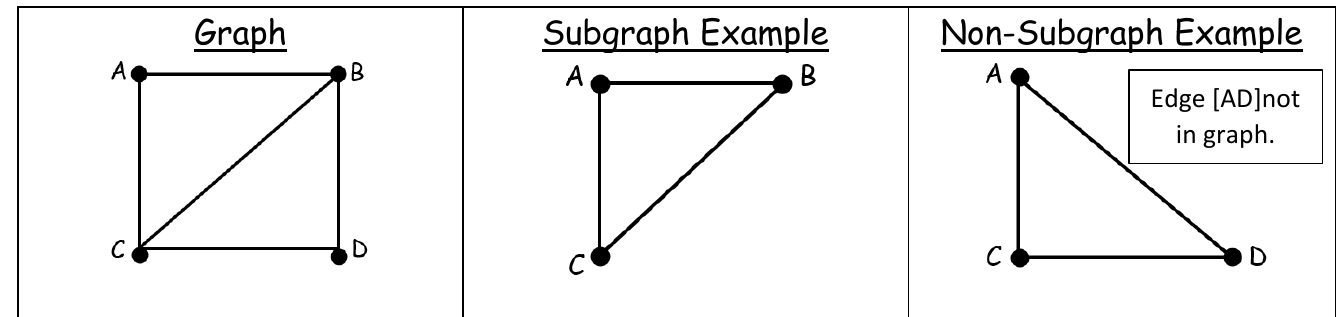
A subgraph is like a smaller version of a larger graph, but with strict rules about what can be included.
Rules for Subgraphs
For a graph P to be a subgraph of graph Q, two conditions must be met:
- All vertices in P must also exist in Q
- All edges in P must also exist in Q
You can't add new edges that weren't in the original graph, and you can't connect vertices in ways they weren't connected before.
Think of it like selecting a group of friends from your entire friendship network - you can only include the friendships that actually exist, not create new ones.
Simple graphs and loops
Not all graphs follow the same rules about connections, which leads us to important distinctions.
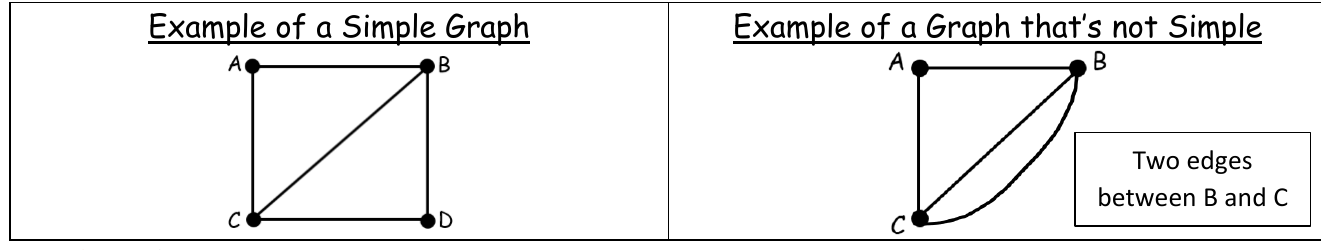
A simple graph follows two key rules: it has no loops (edges from a vertex to itself), and it has at most one edge between any pair of vertices. Most basic network diagrams you'll encounter are simple graphs.
Rules for Simple Graphs
- No loops (no edges from a vertex to itself)
- At most one edge between any pair of vertices
- These restrictions make simple graphs easier to analyse and work with
A loop is a special type of edge that connects a vertex to itself. While they might seem odd, loops can represent important real-world situations, like a person having a relationship with themselves or a city having internal transportation systems.
Walks, paths, and cycles
Understanding how to move through a graph is essential for many applications.
A walk is a sequence of edges where you move from one vertex to another. The length of a walk is determined by the number of edges you traverse. You're allowed to visit the same vertex multiple times during a walk.
A path is a special type of walk where all vertices are different - you never visit the same vertex twice. Paths are like taking a journey where you never backtrack to a place you've already been.
A cycle is a closed path that starts and ends at the same vertex. Think of it like taking a circular route that brings you back to your starting point.
Example: Moving Through a City Network
Consider vertices A, B, C, D connected in a network:
- Walk: A → B → C → B → D (length = 4 edges, vertex B visited twice)
- Path: A → B → C → D (length = 3 edges, all vertices different)
- Cycle: A → B → C → A (closed path returning to start)
Connected graphs
The concept of connectivity tells us whether we can reach every part of a graph from any starting point.
A graph is connected if there's a path between every pair of vertices. This means you can travel from any vertex to any other vertex by following the edges. If this isn't possible, the graph is disconnected.
Connectivity is crucial in network design - you want to ensure that every part of your network can communicate with every other part. A disconnected network means some parts are isolated and unreachable.
Adjacency and incidence
These terms describe the relationships between vertices and edges in precise mathematical language.
Two vertices are adjacent if they're directly connected by an edge. Think of adjacent vertices as immediate neighbours in the network.
Incidence describes the relationship between vertices and edges. When an edge connects two vertices, we say the vertices are incident with the edge, and the edge is incident with the vertices. It's simply a formal way of saying "this edge touches these vertices."
Trees and spanning trees
Trees are special types of graphs with unique properties that make them incredibly useful.
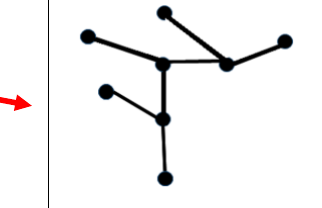
A tree is a connected graph with no cycles. Think of a family tree or the branching structure of an actual tree - there's always exactly one path between any two points, and there are no closed loops.
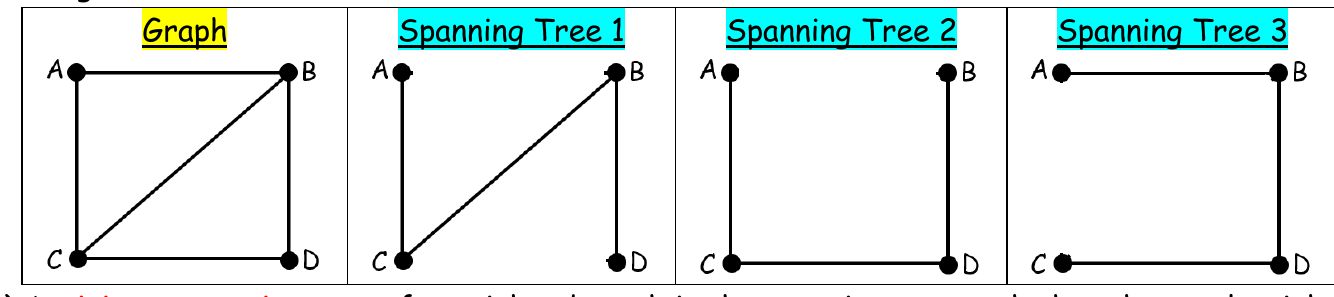
A spanning tree of a graph is a subgraph that includes all the original vertices and forms a tree. It's like finding the minimum number of edges needed to keep all vertices connected without creating any cycles.
A minimum spanning tree is the spanning tree with the smallest total weight when working with weighted graphs. This concept is crucial in network design, helping find the most cost-effective way to connect all points in a network.
Example: Network Cable Installation
When installing cables to connect offices in a building:
- A spanning tree ensures all offices are connected
- A minimum spanning tree uses the least amount of cable
- This saves money while maintaining full connectivity
The hand-shaking lemma
This important theorem provides a fundamental relationship in graph theory.
The Hand-shaking Lemma states that the sum of all vertex degrees in a graph equals twice the number of edges. This happens because each edge contributes to the degree of exactly two vertices.
Hand-shaking Lemma Formula
Where:
- = sum of all vertex degrees
- = number of edges
This relationship always holds true because each edge connects exactly two vertices, contributing 1 to each vertex's degree.
This lemma is incredibly useful for checking your work and understanding the structure of graphs. It's called the "hand-shaking lemma" because if you imagine each edge as a handshake between two people, each handshake involves exactly two hands.
Key Points to Remember:
- Graphs consist of vertices (nodes) connected by edges (arcs) - these are the fundamental building blocks
- Vertex degree counts the number of edges meeting at that vertex - it shows how connected each point is
- Directed graphs have arrows showing relationship direction, undirected graphs show mutual relationships
- Simple graphs have no loops and at most one edge between any pair of vertices
- Trees are connected graphs with no cycles, making them perfect for hierarchical structures
- The hand-shaking lemma provides a fundamental check: sum of degrees = 2 × number of edges