Gantt Charts (Leaving Cert Applied Maths): Revision Notes
Gantt Charts
What is a Gantt chart?
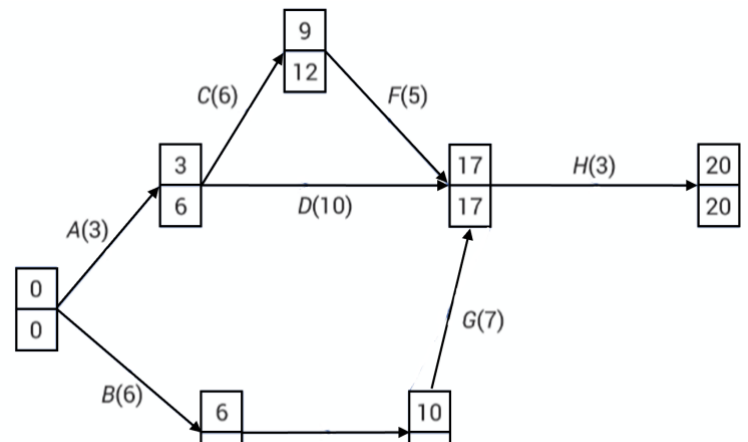
A Gantt chart is a visual project management tool that displays an activity network as a timeline. It shows when activities should start and finish, how long they take, and how much flexibility (float time) each activity has in its scheduling.
Think of a Gantt chart as a horizontal bar chart where each bar represents a different project activity. The length of each bar shows the duration of that activity, and its position shows when the activity should happen during the project timeline.
The visual nature of Gantt charts makes them particularly effective for communicating project timelines to team members and stakeholders who may not be familiar with technical project management terminology.
Key components of Gantt charts
Critical path activities
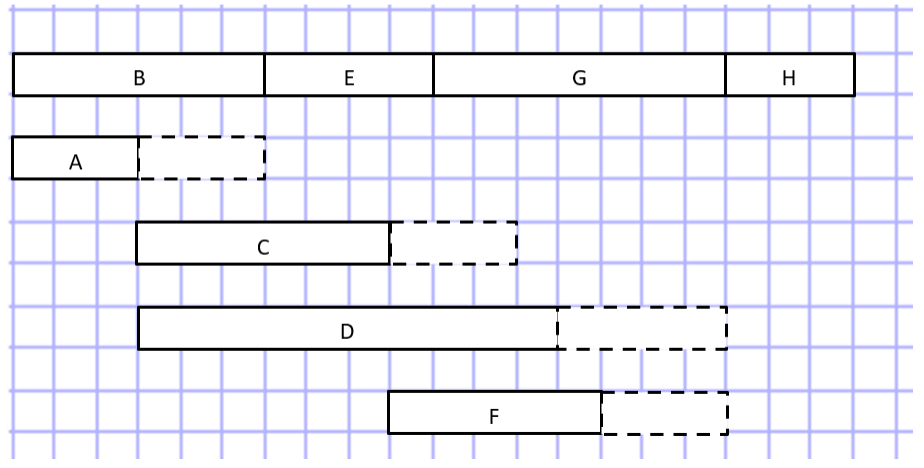
The critical path consists of activities that have zero total float time. These activities must be completed exactly on schedule because any delay will delay the entire project. In a Gantt chart, critical path activities are typically placed at the top and shown as solid bars.
Critical Path Activities Are Non-Negotiable
Activities on the critical path have no scheduling flexibility. Even a one-day delay in a critical activity will delay the entire project completion by one day. This is why they require the closest monitoring and attention.
Total float time
Total float is the amount of time an activity can be delayed without affecting the project's completion date. Activities with float time offer scheduling flexibility, whilst those with zero float are critical to the project timeline.
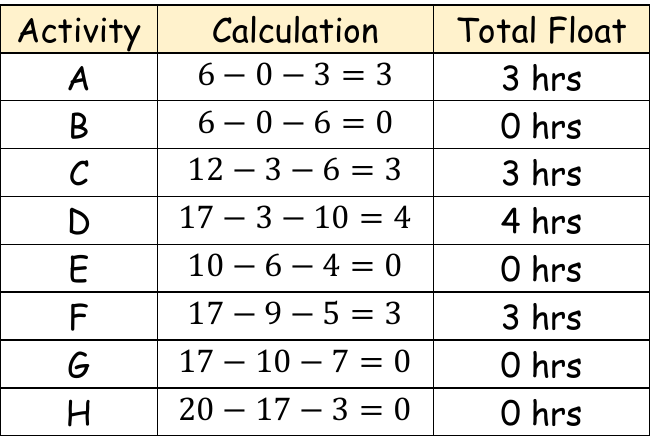
The calculation for total float follows this pattern:
Visual representation of float
Non-critical activities are shown with dashed line extensions in Gantt charts. The solid bar represents the activity's duration, whilst the dashed portion shows the additional time available (the float time) before the activity would impact the project schedule.
Creating a Gantt chart
To create a Gantt chart from an activity network, follow these essential steps:
Step-by-Step Gantt Chart Creation Process
- Identify the critical path by calculating total float for each activity
- Place critical activities first at the top of the chart, as they have no scheduling flexibility
- Create a time scale along the horizontal axis covering the entire project duration
- Draw activity bars showing each activity's duration and start time
- Add dashed extensions for non-critical activities to show their float time
Reading and interpreting Gantt charts
Time-based analysis
When examining a Gantt chart at any specific time, you can determine:
- Activities that must be happening: These appear as solid bars at that time point
- Activities that might be happening: These could be occurring if they've used some of their float time
Practical scheduling insights
Gantt charts help project managers understand:
- Which activities can be delayed without affecting the project
- When resources need to be available for specific activities
- How activities relate to each other in terms of timing
- The overall project timeline and critical milestones
Benefits for project management
Gantt charts provide several advantages for project planning and monitoring:
- Visual clarity: Easy to see the entire project timeline at a glance
- Resource planning: Helps identify when different resources are needed
- Progress tracking: Shows whether activities are on schedule
- Risk identification: Highlights critical activities that need close monitoring
- Communication tool: Helps explain project timelines to stakeholders
Exam tips
Essential Exam Strategies for Gantt Charts
When working with Gantt chart questions:
- Always identify the critical path first by finding activities with zero float
- Place critical activities at the top of your chart
- Use solid bars for activity duration and dashed lines for float time
- Remember that activities on the critical path must happen exactly as scheduled
- Check your time scale carefully to ensure accurate positioning
Key Points to Remember:
-
Gantt charts visually display project timelines showing activity durations, start times, and scheduling flexibility
-
Critical path activities have zero float and must be completed on time to avoid project delays
-
Float time is shown with dashed extensions indicating how much an activity can be delayed without affecting the project
-
Activities are positioned horizontally according to when they occur in the project timeline
-
Gantt charts help identify which activities must be happening versus which might be happening at any given time