Ratio Analysis (Leaving Cert Business): Revision Notes
📚 Revision Notes
Ratio Analysis
infoNote
Ratio analysis is a financial tool used to evaluate a company's performance and financial health by comparing various figures from its financial statements. It involves calculating and interpreting ratios to provide insights into how well a company is operating and its financial stability.
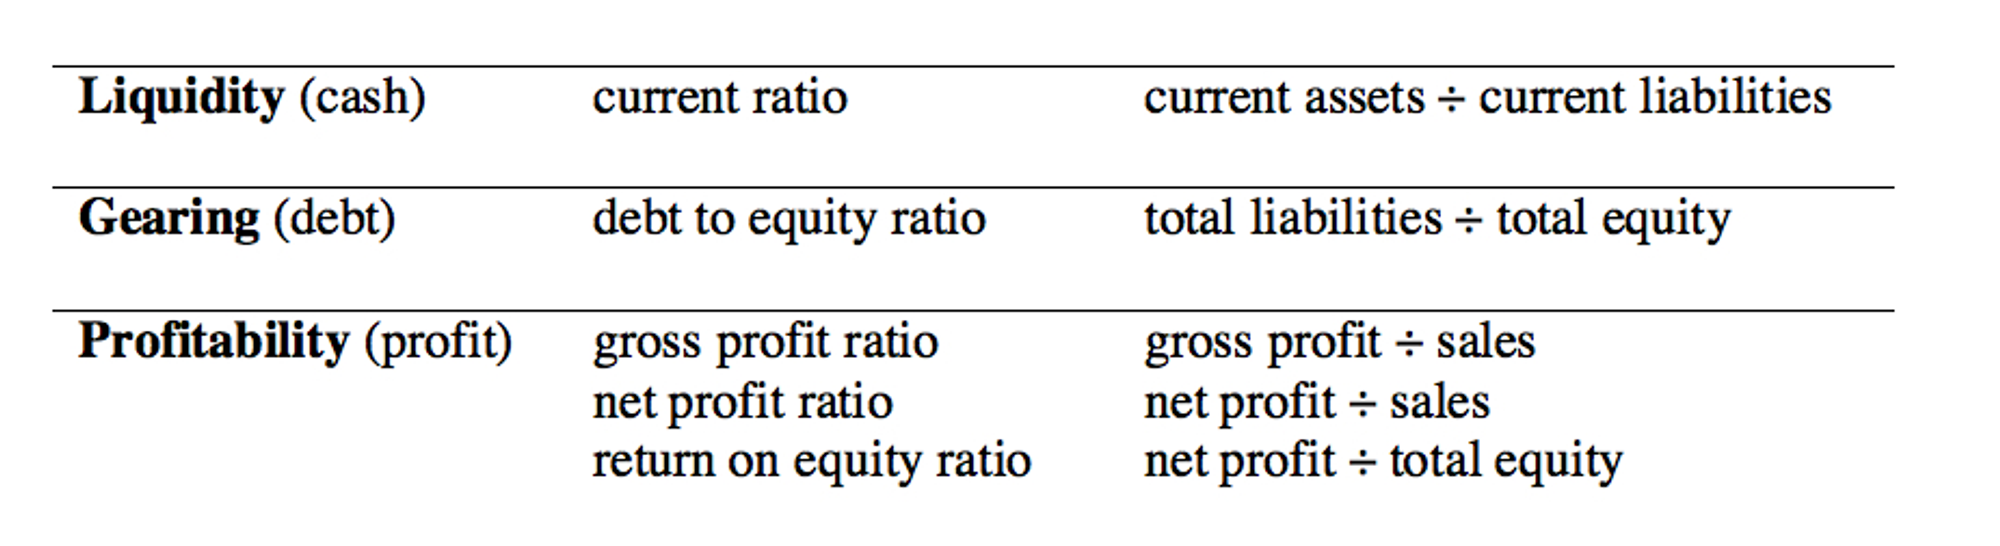
Gross Profit Margin/Gross Profit Percentage
- Formula: (Gross Profit / Sales) x 100
- Description: This ratio measures the percentage of revenue that exceeds the cost of goods sold (COGS), indicating how efficiently a company produces its goods.
- Good Result: A higher gross profit margin is preferable as it suggests that the company is effectively managing its production costs relative to its sales.
Net Profit Margin/Net Profit Percentage
- Formula: (Net Profit / Sales) x 100
- Description: This ratio measures the percentage of revenue remaining after all expenses, taxes, and costs have been deducted, indicating overall profitability.
- Good Result: A higher net profit margin is better as it indicates that the company retains more of its revenue as profit.
Return on Investment
- Formula: (Net Profit / Capital Employed) x 100
- Description: This ratio measures the gain or loss generated on an investment relative to the amount of money invested, indicating the efficiency of the investment.
- Good Result: A higher ROI is better as it shows that the investment is generating substantial returns.
Current Ratio
- Formula: Current Assets : Current Liabilities
- Description: This ratio measures a company's ability to pay off its short-term liabilities with its short-term assets, indicating liquidity.
- Good Result: A current ratio above 2:1 is good, as it indicates that the company has enough assets to cover its liabilities without being overly reliant on cash flow.
Acid Test Ratio/Quick Ratio
- Formula: (Current Assets - Closing Stock) : Current Liabilities
- Description: This ratio measures a company's ability to meet its short-term obligations with its most liquid assets, excluding inventory.
- Good Result: A quick ratio of 1:1 or higher is considered good, as it indicates that the company can meet its short-term liabilities without selling inventory.
Gearing Ratio/Debt to Equity Ratio
- Formula: Total Debt : Total Equity
- Description: This ratio measures the proportion of a company's debt to its shareholders' equity, indicating financial leverage.
- Good Result: A lower debt/equity ratio is better, typically below 1:1, as it suggests that the company is not overly reliant on debt to finance its operations. A company with an ideal gearing ratio (For example 0.78:1) is considered lowly geared. A company with a large amount of debt relative to equity (For example 3.4:1) is considered highly geared. It is preferable to be lowly geared.
Limitations of Ratio Analysis
- Historical Data: Ratios use past data, which may not reflect future performance. They don't show recent changes or trends.
- No Qualitative Factors: Ratios ignore management skills, company culture, and other non-numerical aspects that affect performance.
- Industry Differences: Ratios can vary greatly between different industries. This makes it hard to compare companies in different sectors accurately.