Changes in Sunlight Intensity (Leaving Cert CASD): Revision Notes
Changes in Sunlight Intensity
What is solar irradiance?
Solar irradiance refers to the amount of energy from the Sun that reaches Earth's atmosphere. Scientists measure this as Total Solar Irradiance (TSI), which represents the Sun's brightness or energy output per unit area.
The solar constant is approximately - this is the average amount of solar energy hitting the top of Earth's atmosphere. However, this "constant" actually varies slightly over time due to changes in the Sun's activity.
Total Solar Irradiance (TSI) is measured at the top of Earth's atmosphere, before any solar energy is absorbed or reflected by our planet's atmosphere. This standardised measurement allows scientists to track changes in the Sun's energy output over time.
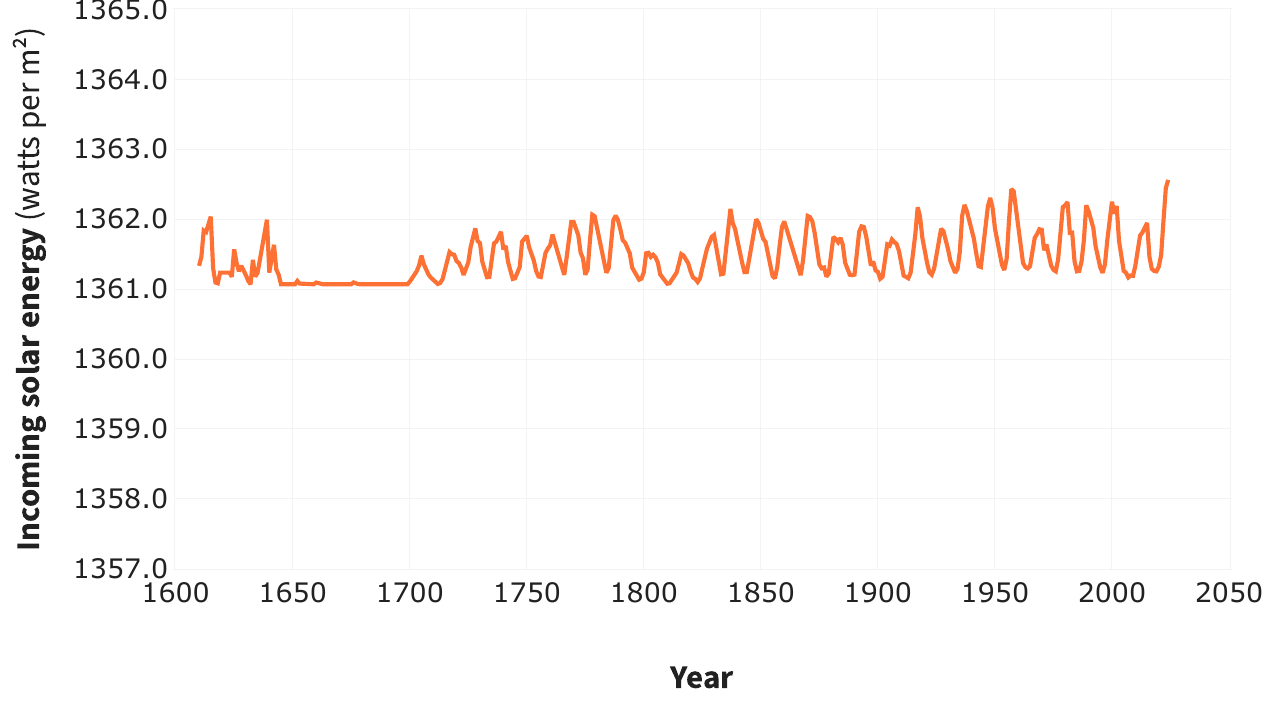
These variations in solar irradiance can influence Earth's climate system. When the Sun becomes brighter, more energy reaches Earth, potentially leading to warming. Conversely, when solar output decreases, less energy reaches Earth, which can contribute to cooling.
Short-term solar variations: the 11-year solar cycle
The Sun's brightness changes in a regular pattern known as the solar cycle or Schwabe cycle, which lasts approximately 11 years. This cycle is driven by changes in the Sun's magnetic field, which regularly reverses its polarity.
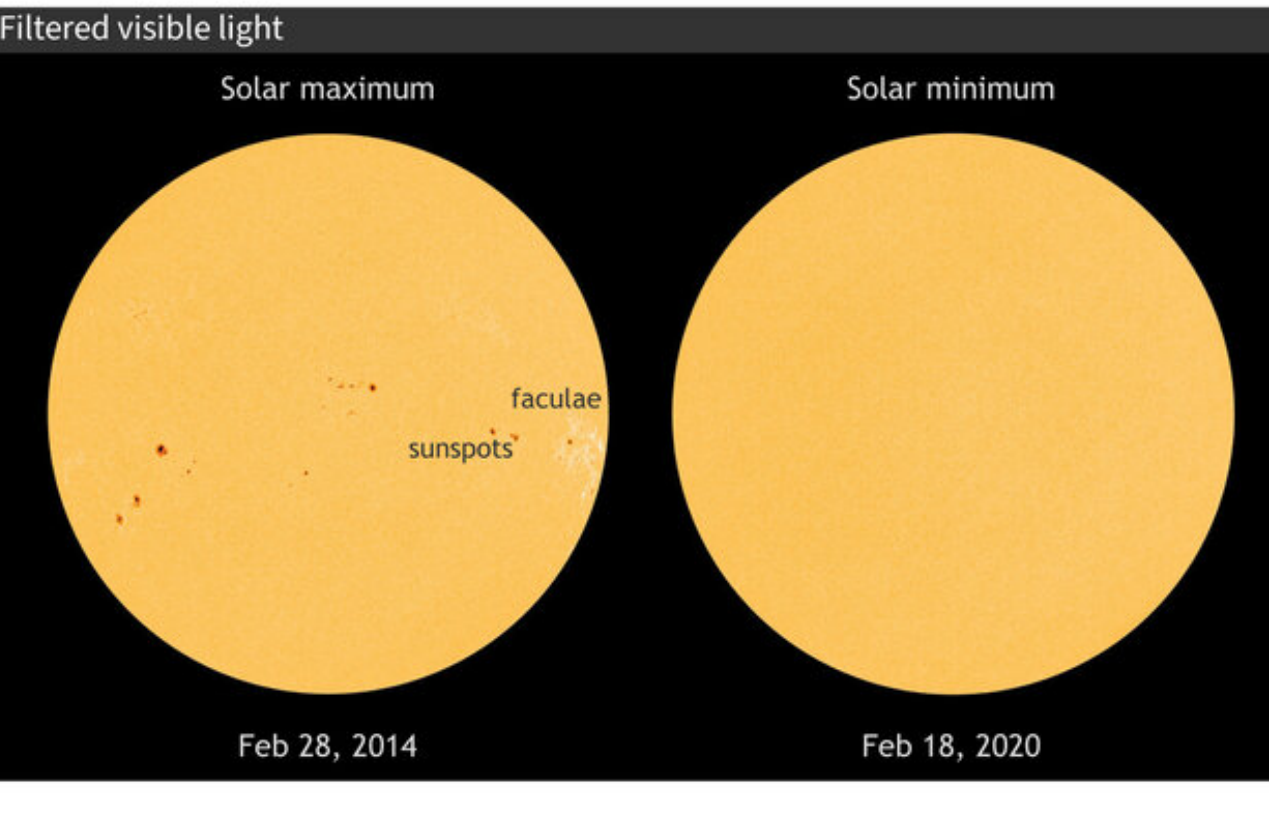
Solar maximum vs solar minimum
During the solar cycle, the Sun alternates between periods of high and low activity:
-
Solar maximum: The Sun shows many dark spots called sunspots and bright regions called faculae
-
Solar minimum: The Sun appears relatively smooth with few or no visible sunspots
Understanding sunspots and faculae
Sunspots are temporary dark patches on the Sun's surface where the magnetic field is so strong that it blocks heat flow. These regions are cooler than their surroundings, making them appear darker.
Faculae are bright magnetic regions that more than compensate for the dimming effect of sunspots. These bright areas spread across more of the Sun's surface than sunspots cover.
Magnitude of solar cycle variations
Solar Brightness Variation Calculation
The difference in the Sun's total brightness between solar maximum and minimum:
-
Percentage change: approximately
-
Absolute change: about
-
Temperature effect: roughly influence on global average temperature
While this might seem small, it demonstrates the Sun's measurable impact on Earth's climate system.
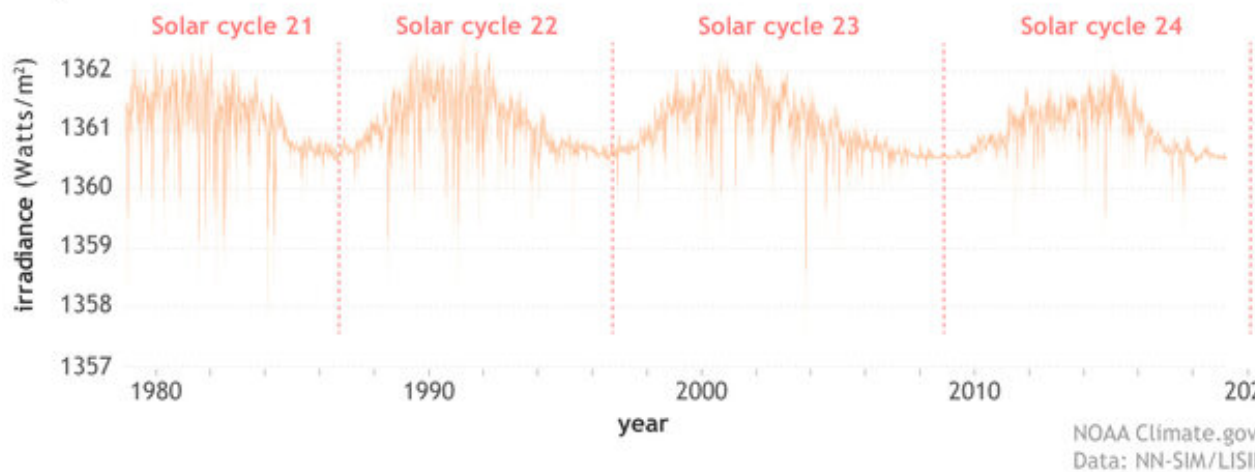
Scientists have been directly measuring solar irradiance using satellites since the late 1970s, allowing them to track these cyclical changes with great precision.
Long-term solar variations
Beyond the 11-year cycle, the Sun also experiences longer-term variations in its activity spanning decades to centuries.
The Gleissberg cycle
The Gleissberg cycle is a roughly 100-year pattern where several strong solar cycles are followed by several weaker ones. This longer cycle modulates the strength of the 11-year cycle.
Grand solar minimums
Sometimes the Sun enters periods of extremely low activity called Grand Solar Minimums, where sunspots virtually disappear for decades.
The Maunder Minimum (1645-1715) was the most famous grand solar minimum. During this 70-year period:
-
Sunspots almost completely disappeared
-
Solar activity was at its lowest level in centuries
-
This period coincided with the coldest part of the Little Ice Age in Europe
This demonstrates how prolonged solar variability can have significant climate impacts over historical timescales.
The Dalton Minimum (1790-1820) was another notable period of reduced solar activity that contributed to cooler global temperatures.
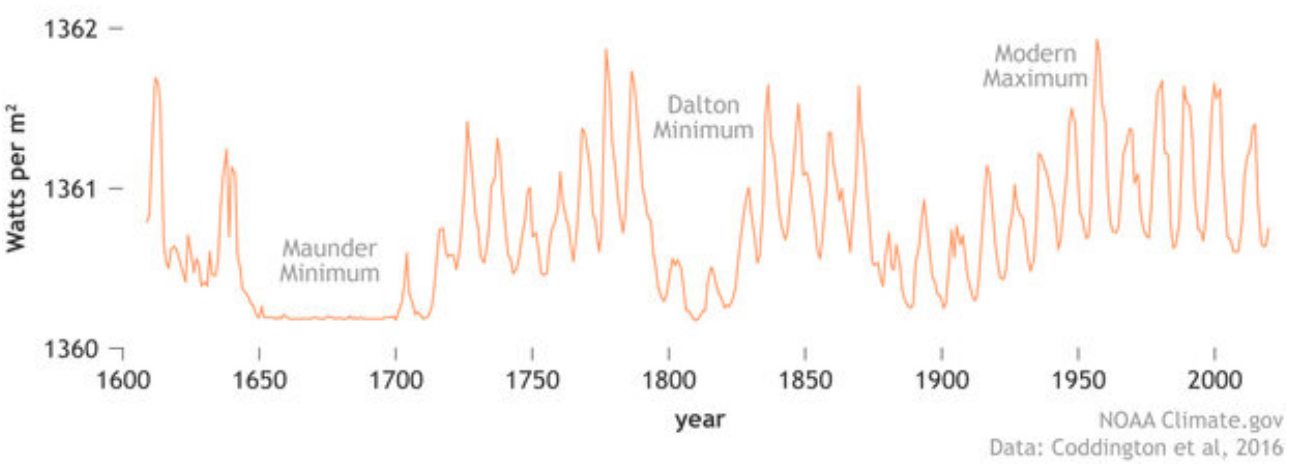
The Modern Maximum
From approximately 1950-2000, the Sun experienced the Modern Maximum - a period of unusually high solar activity. However, since around 2000, solar activity has been declining.
The relationship between these solar variations and historical climate patterns provides important evidence for the Sun's influence on Earth's temperature.
Very long-term solar changes
Scientists can reconstruct solar activity going back thousands of years using cosmogenic isotopes - radioactive atoms created when cosmic rays hit Earth's atmosphere.
When the Sun is more active, its stronger magnetic field blocks more cosmic rays from reaching Earth, resulting in fewer cosmogenic isotopes. When solar activity is low, more cosmic rays reach Earth, creating more isotopes.
This inverse relationship allows scientists to work backwards from isotope concentrations to determine past solar activity levels.
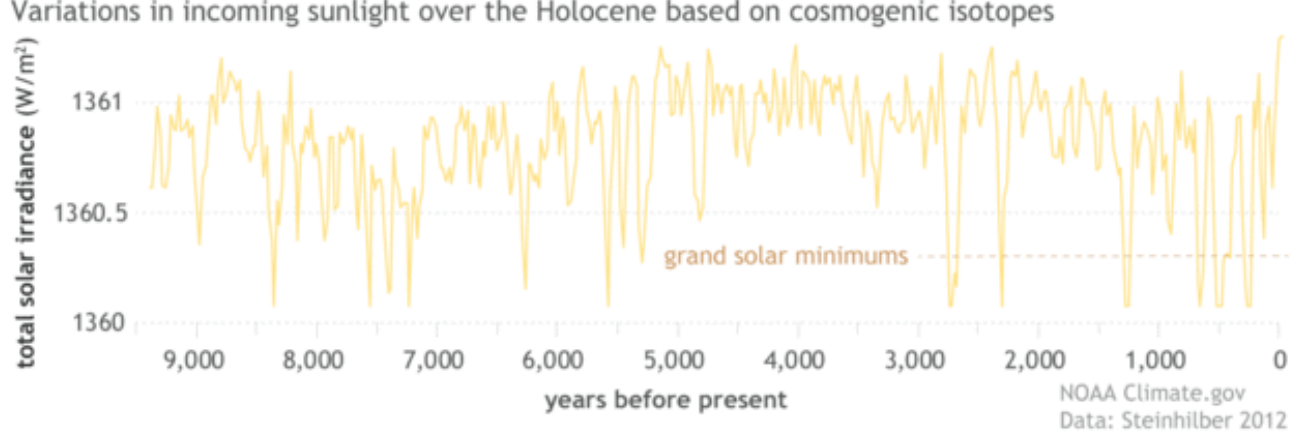
These reconstructions show that over the past 9,000 years (the Holocene period), the Sun has experienced at least 25 grand solar minimums. Some lasted only 2-3 decades, while others, like the Maunder Minimum, persisted for many decades.
Milankovitch cycles and ice ages
Over much longer timescales (thousands to hundreds of thousands of years), changes in Earth's orbit around the Sun cause significant variations in the amount of sunlight reaching different parts of our planet.
The three orbital cycles
Milankovitch cycles describe three key changes in Earth's orbit:
The Three Milankovitch Cycles
-
Precession:
-
The slow wobble in Earth's axis of rotation
-
Changes when seasons occur relative to Earth's distance from the Sun
-
-
Obliquity:
-
Changes in the tilt of Earth's axis
-
Affects the contrast between seasons
-
-
Eccentricity:
-
Changes in how elliptical (oval-shaped) Earth's orbit becomes
-
Controls Earth's distance variation from the Sun
-
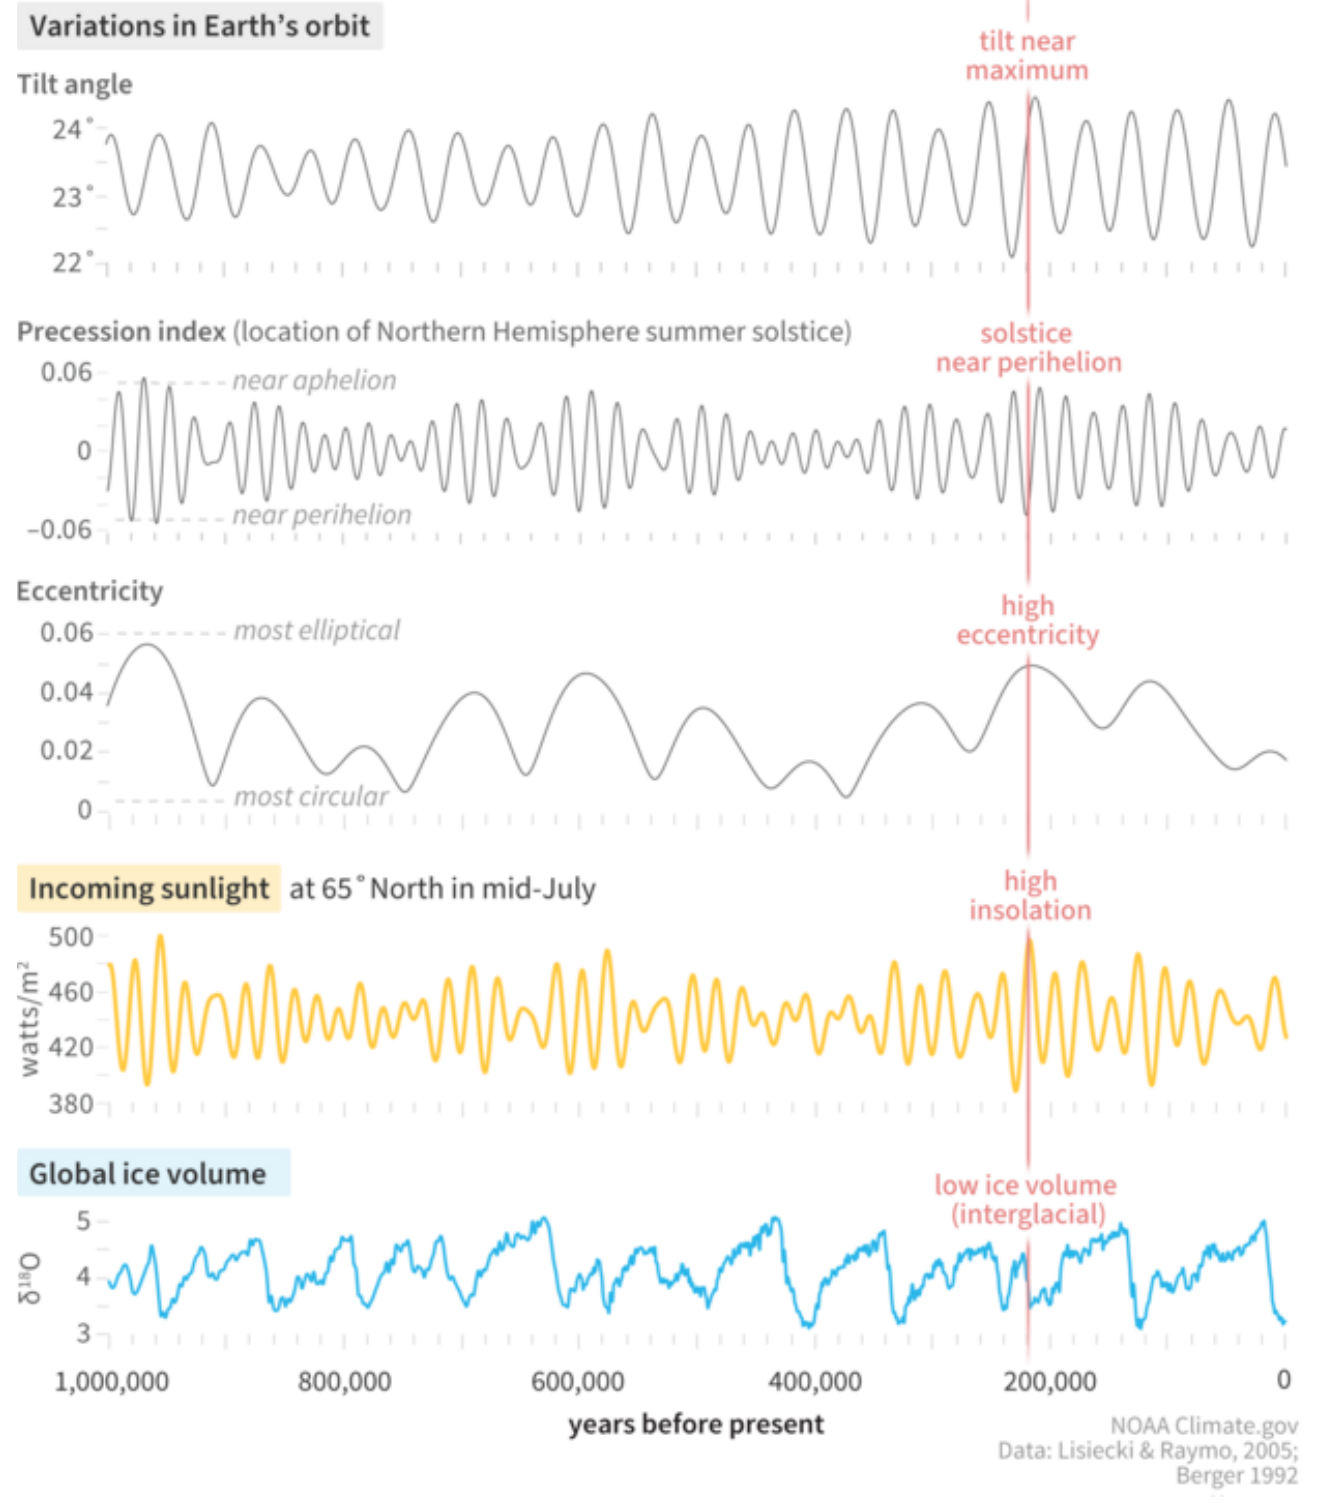
These orbital variations combine to create complex patterns of insolation (incoming solar radiation) that drive the ice age cycles. When Northern Hemisphere summers receive less sunlight, ice sheets can grow, potentially triggering an ice age.
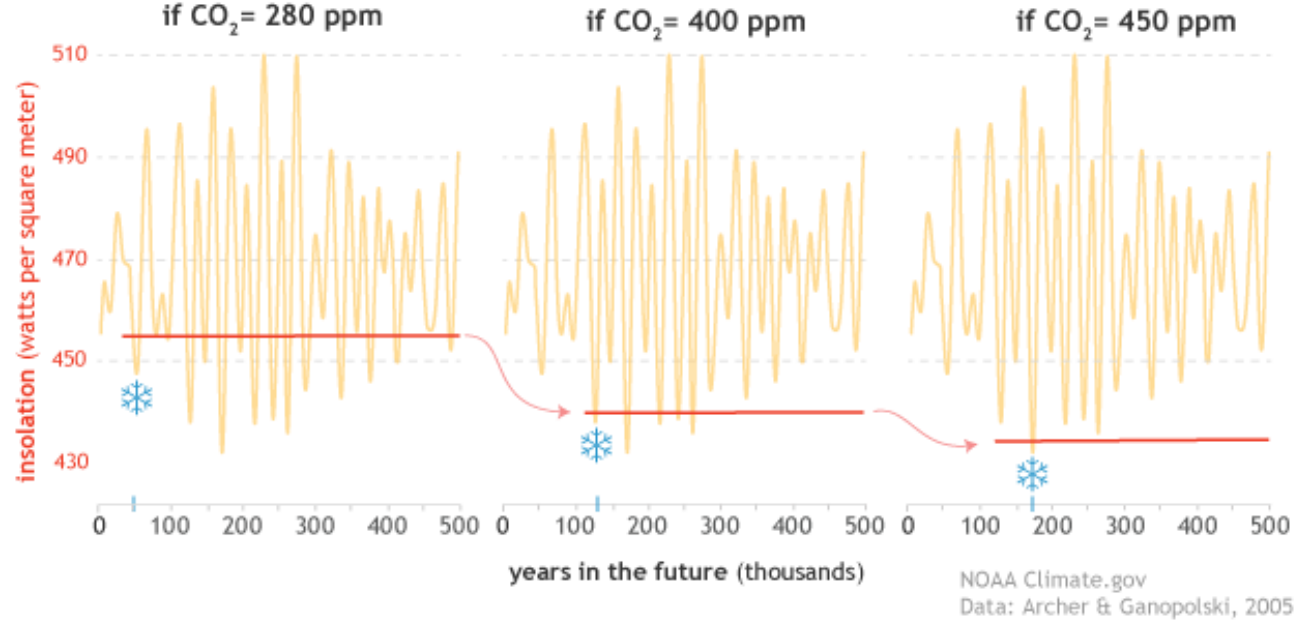
Future ice ages and climate change
Under natural conditions, Milankovitch cycles would continue to drive ice age patterns. However, rising atmospheric carbon dioxide levels from human activities are now disrupting this natural cycle.
Higher CO₂ concentrations make it much harder for ice ages to begin, potentially postponing the next ice age by tens of thousands of years.
Solar variability and modern climate change
While solar variations have influenced climate throughout history, their role in recent climate change is minimal compared to human activities.
Solar influence vs greenhouse warming
Since 1850, the Sun's influence on global temperature has been very small - contributing no more than to the roughly of warming that has occurred during the industrial period.
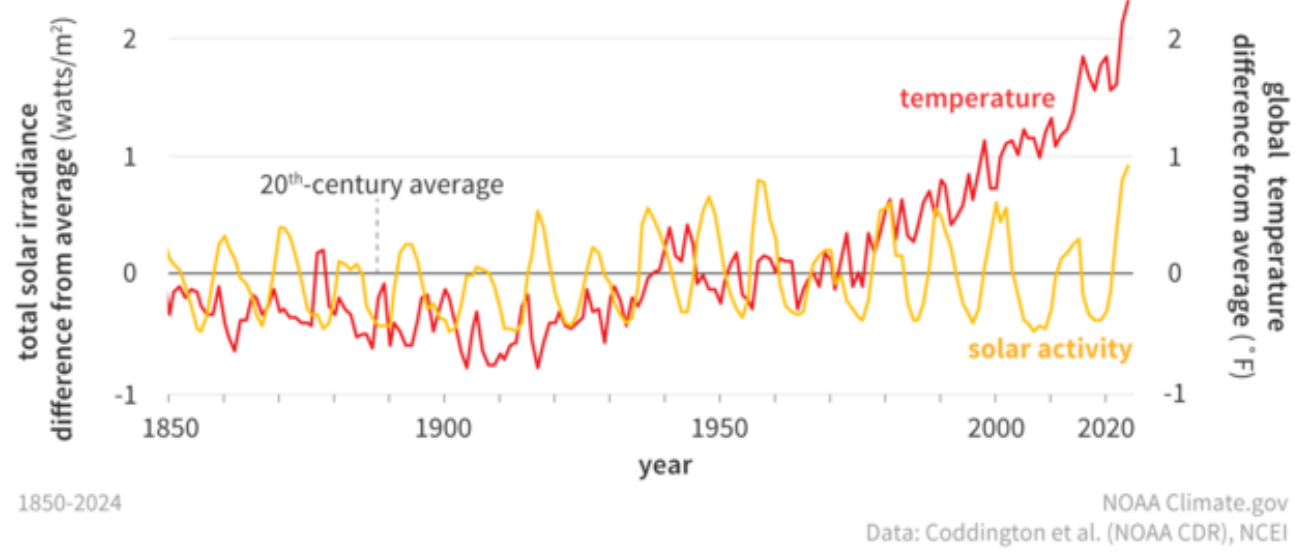
Even if the Sun were to enter a strong grand solar minimum similar to the Maunder Minimum, it would only reduce future warming by a small amount, not prevent it.
The overwhelming influence of rising CO₂ and other greenhouse gases far outweighs any potential cooling effect from reduced solar activity.
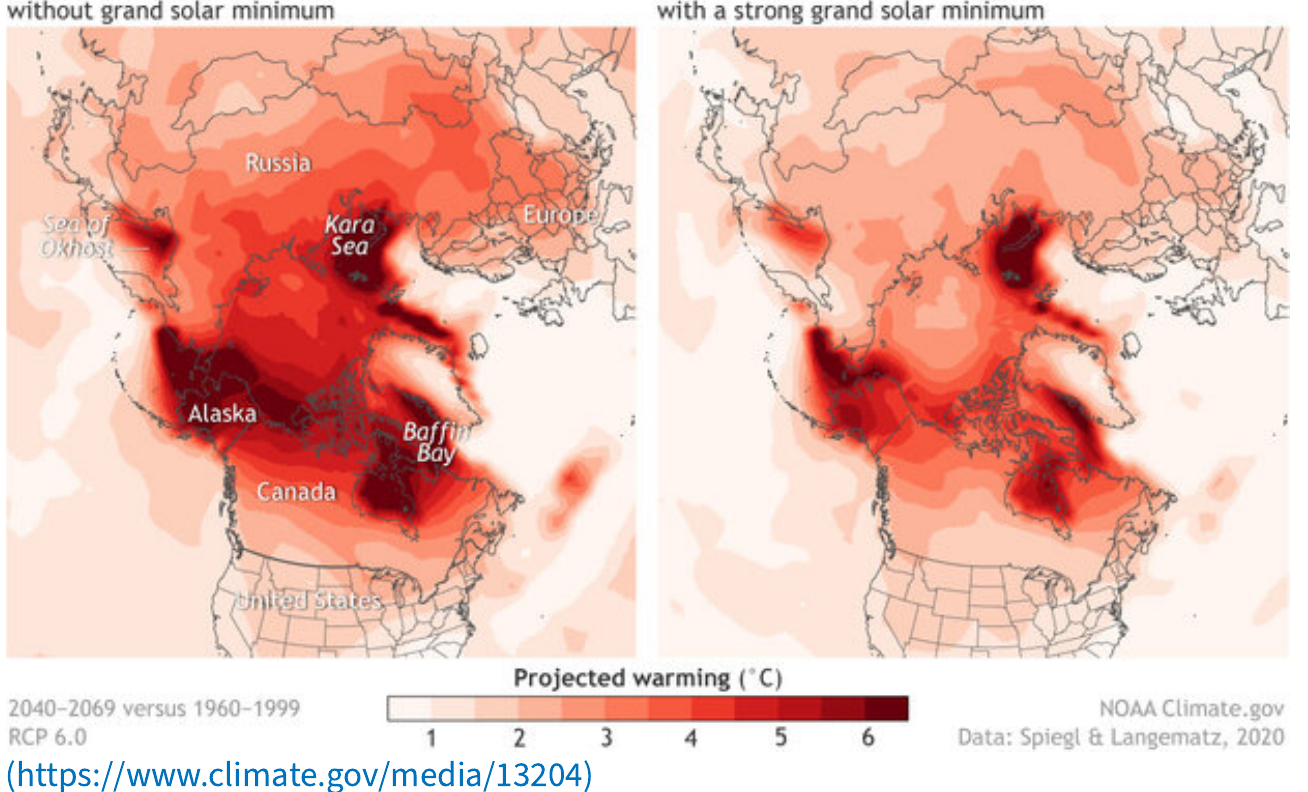
Future solar minimum scenarios
Climate models show that even under a strong grand solar minimum, Arctic regions would continue to experience significant warming due to greenhouse gas increases.
Key Points to Remember:
-
Solar irradiance varies on multiple timescales, from 11-year cycles to millennial patterns, affecting Earth's climate system
-
The 11-year solar cycle causes brightness variations of about , with solar maximum showing more sunspots and faculae than solar minimum
-
Grand solar minimums like the Maunder Minimum can last decades and contribute to significant cooling periods such as the Little Ice Age
-
Milankovitch cycles drive ice age patterns through changes in Earth's orbit affecting seasonal sunlight distribution
-
While solar variations influenced historical climate, modern climate change is overwhelmingly driven by greenhouse gas increases, not solar changes