Human-Induced Global Warming (Leaving Cert CASD): Revision Notes
Human-Induced Global Warming
What is human-induced global warming?
Global warming refers to the increase in Earth's average surface temperature that has been occurring since the Industrial Revolution. This warming is primarily driven by human activities rather than natural climate variations.
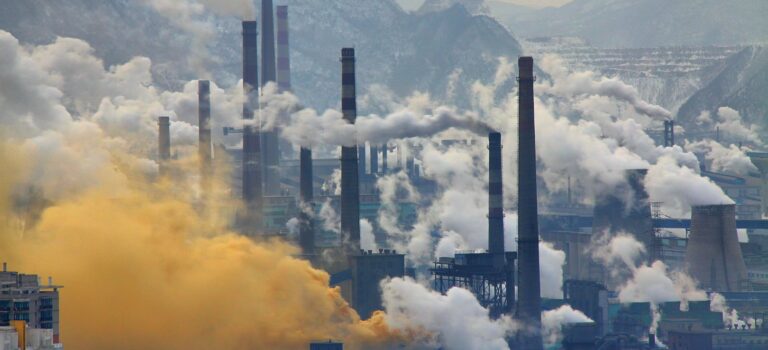
The main cause is the enhanced greenhouse effect. When humans burn fossil fuels, engage in deforestation, and carry out industrial processes, we release extra greenhouse gases into the atmosphere. The most important of these gases are:
-
Carbon dioxide (CO₂) - from burning coal, oil, and gas
-
Methane (CH₄) - from agriculture and waste
-
Nitrous oxide (N₂O) - from fertilisers and industry
These additional greenhouse gases trap more heat in Earth's atmosphere, leading to global temperature rise and widespread climate change impacts.
The greenhouse effect is a natural process that keeps Earth warm enough to support life. However, human activities have enhanced this effect by adding extra greenhouse gases to the atmosphere, causing more heat to be trapped than occurs naturally.
Using secondary data as evidence
Secondary data means information that has already been collected by other people or organisations. Examples include scientific reports, graphs, climate records, satellite images, and databases from government agencies and the United Nations.
As a CASD student, you need to be able to interpret and present secondary data to demonstrate that current warming is human-induced rather than natural. Here are the five key types of evidence you should understand:
Critical Skill for Exams: You must be able to distinguish between human-caused and natural climate changes using secondary data. Simply describing data isn't enough - you need to explain how it proves human causation.
Temperature change over time
The evidence shows that global average temperatures have increased by approximately 1.1°C since the late 1800s. This warming has accelerated significantly since the 1970s, coinciding with increased industrial activity and fossil fuel consumption.
Demonstrating Temperature Evidence:
Step 1: Present the data
-
Use line graphs showing rising global or regional temperatures over time
-
Compare current warming trends with natural climate variability from earlier periods
-
Show that recent temperature increases are much faster than natural changes
Step 2: Explain the significance
The speed and timing of current warming closely matches the rise in human greenhouse gas emissions, making it extremely unlikely that natural factors alone could explain the temperature increase.
Precipitation patterns
Climate change is altering rainfall distribution across the planet. Some regions are experiencing increased flooding due to more intense rainfall, whilst others face prolonged droughts as weather patterns shift.
Demonstrating Precipitation Evidence:
Step 1: Present the data
-
Compare rainfall maps from different decades to show changing patterns
-
Examine statistical tables showing annual rainfall totals over time
-
Look for trends in extreme weather events
Step 2: Explain the significance
These precipitation changes are linked to warming oceans and shifting weather systems caused by human emissions. The patterns match climate model predictions based on greenhouse gas increases.
Atmospheric greenhouse gas concentrations
Carbon dioxide levels in the atmosphere have risen dramatically from approximately 280 parts per million (ppm) before the Industrial Revolution to over 410 ppm today. This represents the highest CO₂ concentration in over 3 million years.
Demonstrating Atmospheric CO₂ Evidence:
Step 1: Present the data
-
Use data from the Keeling Curve (measurements from Mauna Loa Observatory in Hawaii)
-
Present ice core data showing CO₂ levels in the past compared with current measurements
-
Show the clear upward trend beginning around 1850
Step 2: Explain the significance
The chemical "fingerprint" of atmospheric CO₂ shows it comes from burning fossil fuels rather than natural sources. This provides direct evidence linking human activities to greenhouse gas increases.
Rising sea levels
Global sea levels have risen by approximately 20 centimetres since 1900. This rise is primarily due to two factors: melting glaciers and ice sheets, and thermal expansion as ocean water warms.
Demonstrating Sea Level Evidence:
Step 1: Present the data
-
Present graphs showing global sea level rise over time
-
Use satellite images showing shrinking glaciers and ice sheets
-
Compare historical and current measurements from tide gauges
Step 2: Explain the significance
Rising seas provide a direct, measurable response to global warming. The rate and timing of sea level rise matches the human-driven warming trend, ruling out natural causes.
Historical testimony
Written records, diaries, and farming logs provide valuable historical evidence of changing weather patterns. Additionally, testimony from older generations highlights how seasons, snowfall patterns, and harvest times have changed within living memory.
Demonstrating Historical Evidence:
Step 1: Present the data
-
Compare modern climate records with local historical accounts
-
Use case studies such as Arctic indigenous communities noticing reduced ice cover
-
Document changes in agricultural practices and seasonal activities
Step 2: Explain the significance
Human experiences provide real-world context that supports scientific data. This evidence shows that climate change is noticeable in everyday life, not just in laboratory measurements.
Key exam tips
When asked to demonstrate evidence for human-induced global warming, follow this three-step approach:
Essential Exam Strategy:
-
State the data type (e.g., CO₂ concentrations, temperature records, precipitation data)
-
Describe the trend (e.g., rising, falling, or changing patterns over time)
-
Explain the link to human activity (e.g., burning fossil fuels causes higher CO₂ levels, which leads to global warming)
This structure ensures you clearly connect the evidence to human causes rather than simply describing the data.
Key Points to Remember:
-
Secondary data provides strong proof that today's warming is caused by humans, not natural changes
-
Temperature rise of 1.1°C since the late 1800s matches increased human emissions
-
CO₂ levels have jumped from 280 ppm to over 410 ppm since industrialisation began
-
Multiple lines of evidence (temperature, sea levels, precipitation, CO₂) all point to human causation
-
The timing and speed of changes rule out natural climate variations as the primary cause