Relief on OS Maps (Leaving Cert Geography): Revision Notes
📚 Revision Notes
Relief on OS Maps
How Relief is Represented on OS Maps
Contour Lines
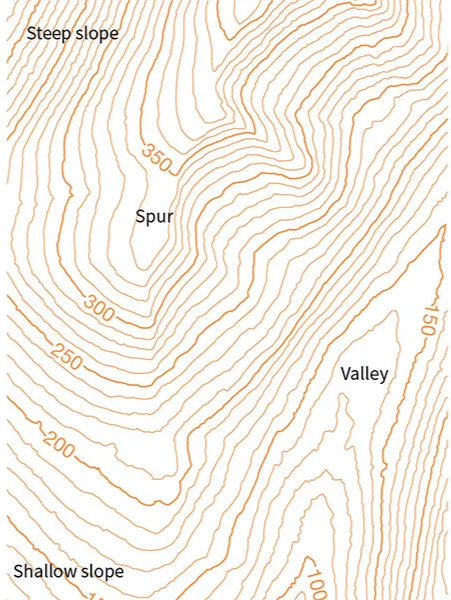
- Definition: Thin brown lines that join points of equal elevation above sea level.
- Interval: On 1:50,000 OS maps, the contour interval is typically 10 metres.
- Key Characteristics:
- Closely spaced contours = steep slopes.
- Widely spaced contours = gentle slopes.
- Circular contours indicate hills or mountains.
Spot Heights
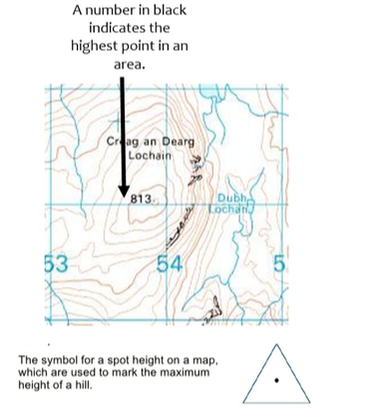
- Definition: Exact elevation at a specific point, marked with a dot and a number (e.g., 350 m).
- Used to identify high points, such as summits.
Triangulation Pillars
- Represented by a small triangle with a spot height.
- Found at prominent hill or mountain peaks, used for surveying.
Shading
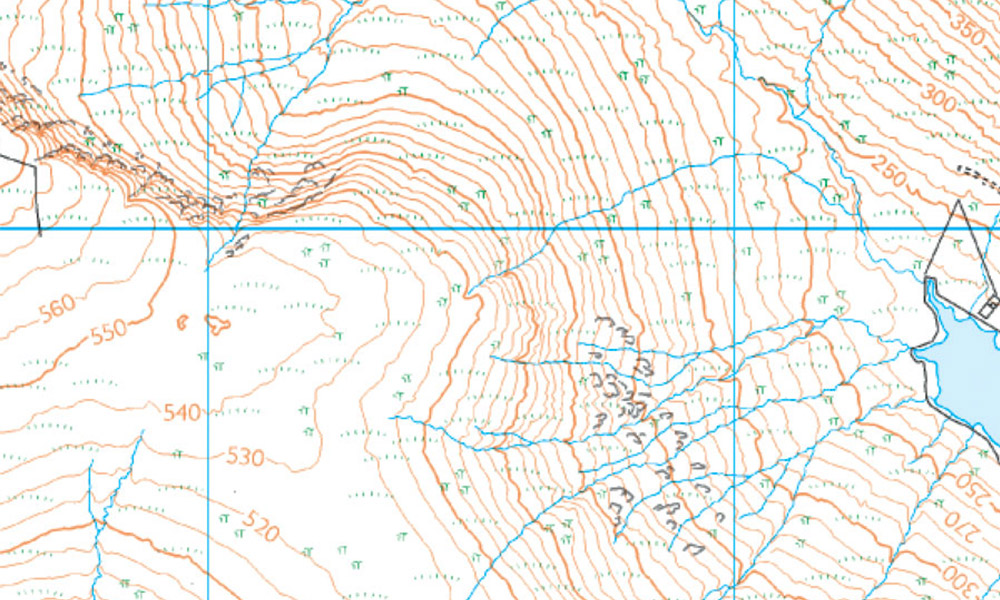
- Some maps use hill shading to indicate relief visually by simulating light and shadow.
Colouring
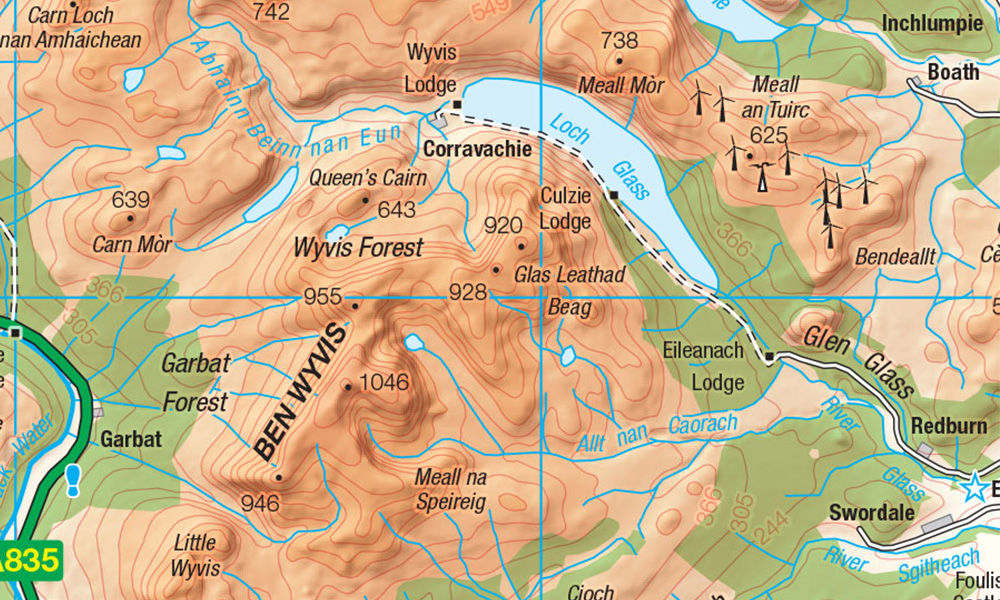
- Often used to show elevation ranges:
- Dark green = lowland.
- Light green/yellow = mid-elevation.
- Brown = highland.
Interpreting Relief Features
Hills and Mountains
- Circular or oval contour patterns with increasing elevation towards the centre.
Valleys
- Contours form a "V" shape pointing upstream.
- Rivers or streams usually flow through the bottom of the valley.
Ridges
- Contours form long, narrow, elevated areas.
Plateaus
- Contours are widely spaced with few changes in elevation over a large area.
Cliffs
- Contours are extremely close together, often merging, indicating vertical or near-vertical slopes.
Applications of Relief in Geography
Understanding Landforms
- Identify features such as hills, valleys, and plains.
Land Use and Settlement
- Analyse how relief influences activities like farming, forestry, and settlement patterns.
- Example: Flat areas are better suited for agriculture, while steep slopes are less accessible.
Navigation
- Plan routes based on terrain difficulty, avoiding steep slopes or following valleys.
Key Tips for Interpreting Relief
- Always check the contour interval on the map's legend.
- Use spot heights and triangulation pillars for precise elevation data.
- Follow the "V" rule for valleys: the "V" points upstream.