Types of Graphs (Leaving Cert Geography): Revision Notes
📚 Revision Notes
Types of Graphs
Graphs are essential tools in geography for presenting and analysing data. They visually represent trends, patterns, and relationships, making them invaluable for geographical studies in the Leaving Certificate syllabus.
Types of Graphs
Line Graphs
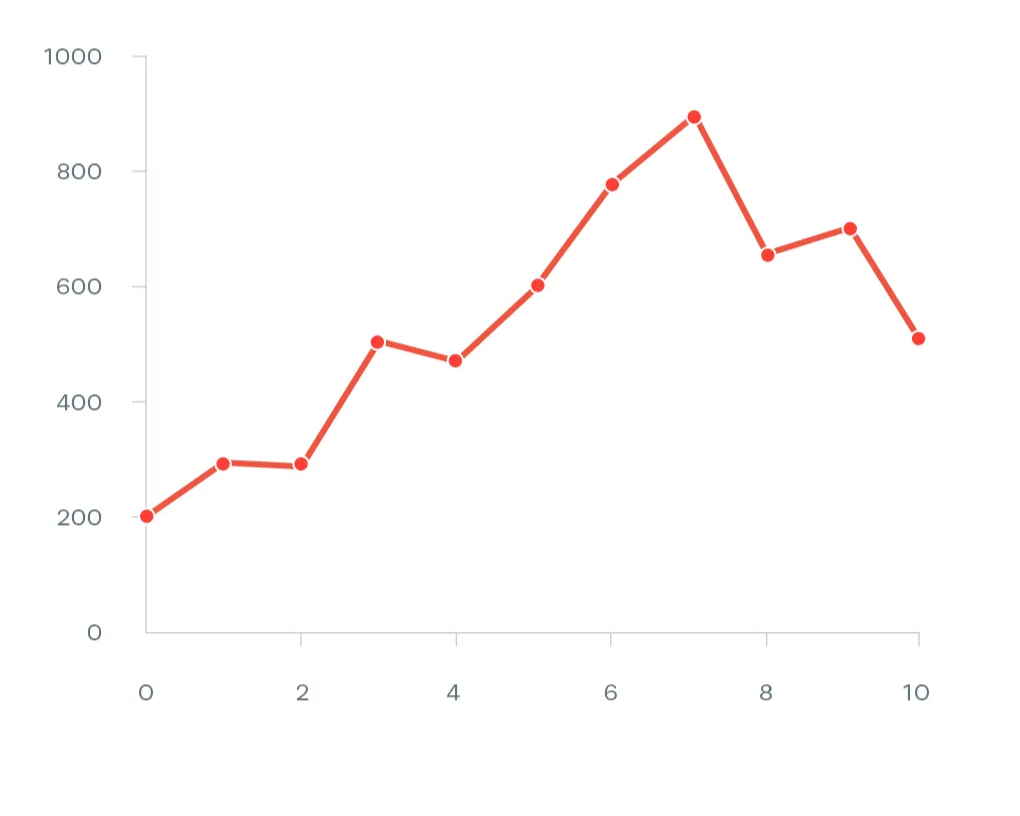
- Purpose: Show changes over time or continuous data.
- Key Features:
- X-axis: Represents time or independent variables.
- Y-axis: Represents values or dependent variables.
- Common Uses:
- Climate graphs (e.g., temperature trends).
- Population growth over time.
Bar Graphs
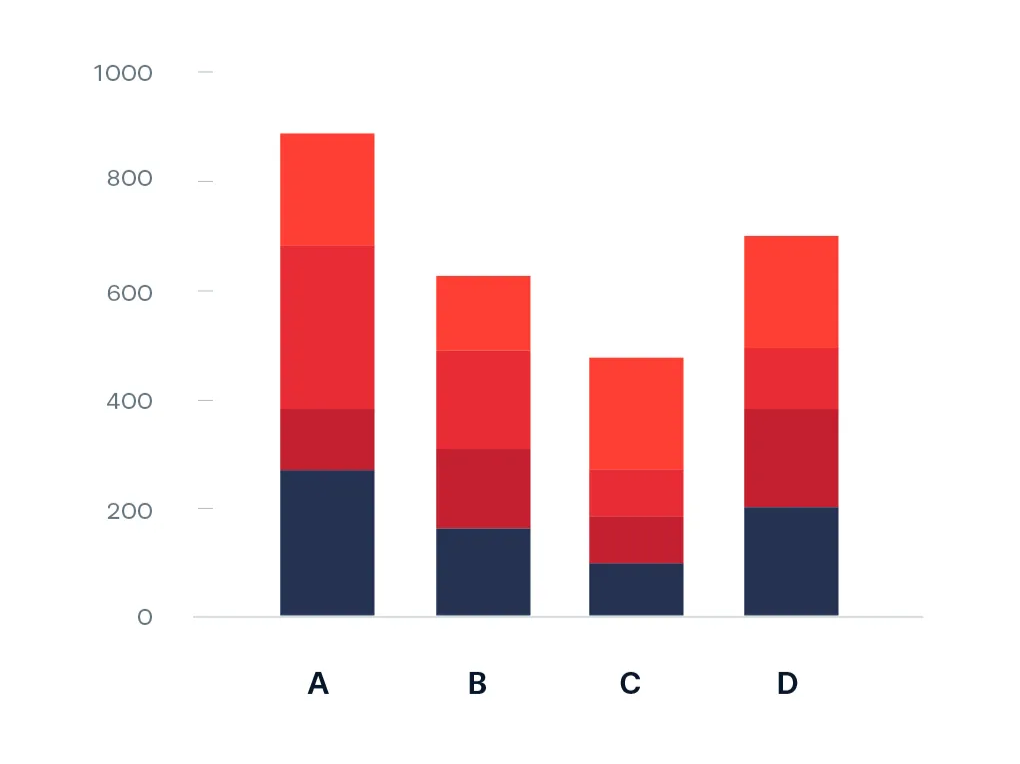
- Purpose: Compare discrete categories or groups.
- Key Features:
- Bars of equal width, spaced apart.
- The heights of the bars represent values.
- Common Uses:
- Comparing population sizes in different regions.
- Land use distribution in urban or rural areas.
Pie Charts
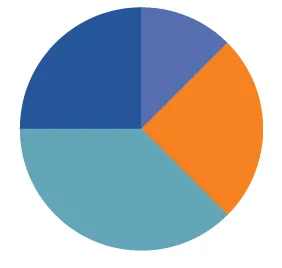
- Purpose: Represent proportions of a whole as percentages.
- Key Features:
- A circle is divided into segments.
- Each segment's size reflects its proportion.
- Common Uses:
- Land use types (e.g., agriculture, industry).
- Population distribution by age or sector.
Scatter Graphs
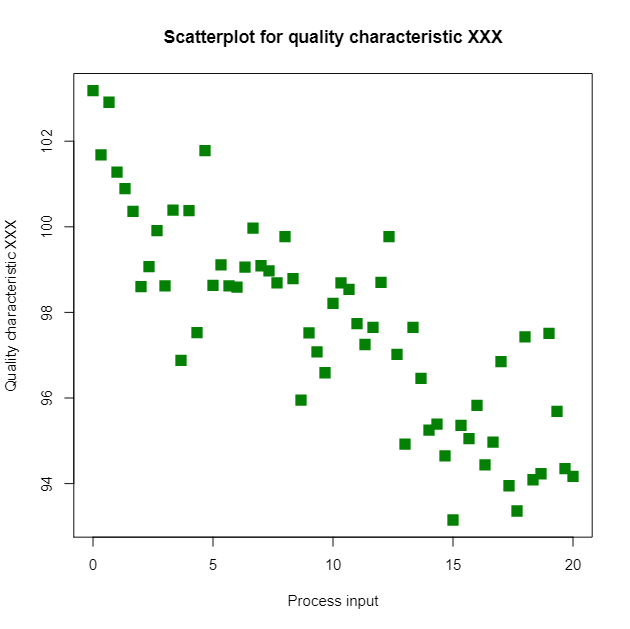
- Purpose: Show relationships between two variables.
- Key Features:
- Points are plotted to show the correlation (positive, negative, or none).
- Common Uses:
- Relationship between temperature and altitude.
- Correlation between population density and economic activity.
Climate Graphs
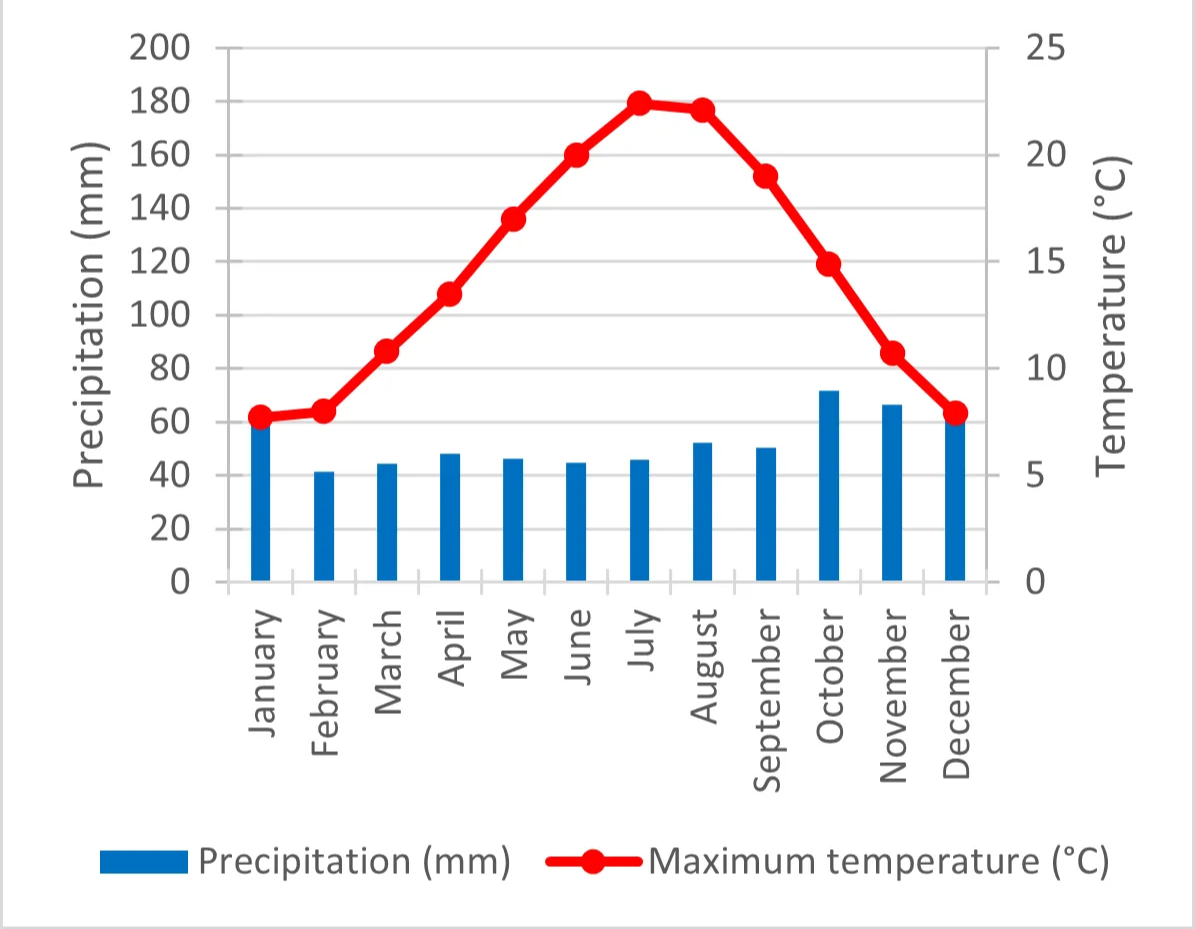
- Purpose: Display temperature and precipitation data for a location.
- Key Features:
- Temperature: Shown as a line graph.
- Precipitation: Represented as bar graphs.
- Common Uses:
- Comparing climates of different regions.
Proportional Symbols (Proportional Circles)
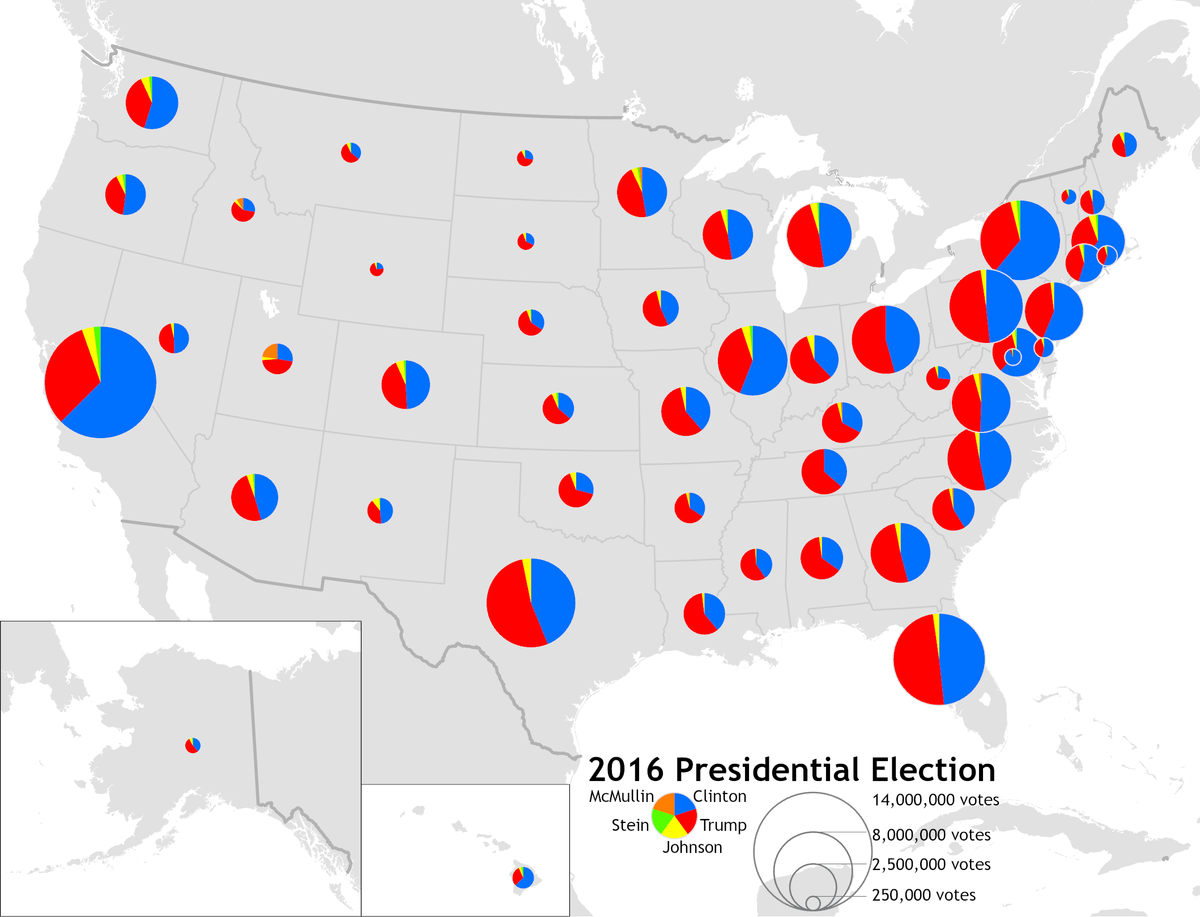
- Purpose: Represent data quantities with symbols of varying sizes.
- Key Features:
- Larger symbols indicate greater quantities.
- Common Uses:
- Representing urban populations on a map.
- Displaying production levels of a resource.
Flow Line Graphs
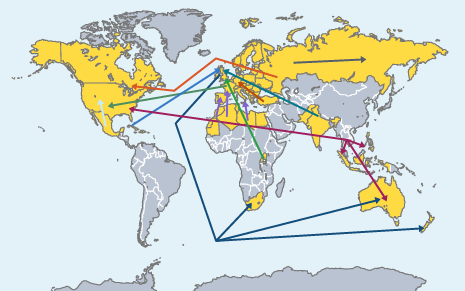
- Purpose: Show the movement of people, goods, or services.
- Key Features:
- Lines vary in thickness to represent volume or quantity.
- Common Uses:
- Migration flows between regions.
- Transport routes and trade volumes.
Population Pyramids
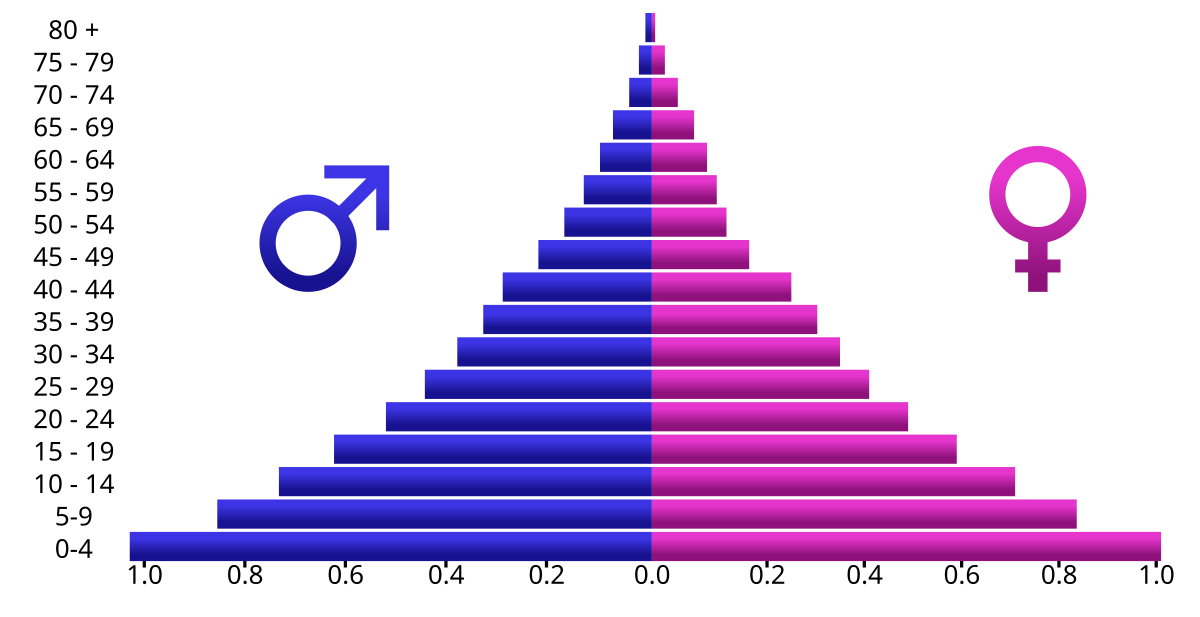
- Purpose: Display the age and gender structure of a population.
- Key Features:
- Two bar graphs are placed side by side (males on one side, females on the other).
- Common Uses:
- Studying demographic trends.
- Comparing population structures of developed and developing countries.