The Argand Diagram (Leaving Cert Mathematics): Revision Notes
The Argand Diagram
What is the Argand diagram?
The Argand diagram is a special type of graph that allows us to represent complex numbers visually. Think of it as a coordinate plane specifically designed for complex numbers, similar to how we use the standard x-y coordinate system for real number pairs.
When we need to show complex numbers on a graph, we create a coordinate system with two perpendicular axes, just like in regular coordinate geometry. However, instead of calling them x and y axes, we give them special names that relate to the parts of complex numbers.
The Argand diagram bridges the gap between algebra and geometry, making abstract complex numbers into visual, concrete points that we can see and work with graphically.
Understanding the axes
The Argand diagram uses two distinct axes that correspond directly to the components of complex numbers:
- Real axis (Re): This is the horizontal axis, similar to the x-axis in regular coordinate geometry
- Imaginary axis (Im): This is the vertical axis, similar to the y-axis in regular coordinate geometry
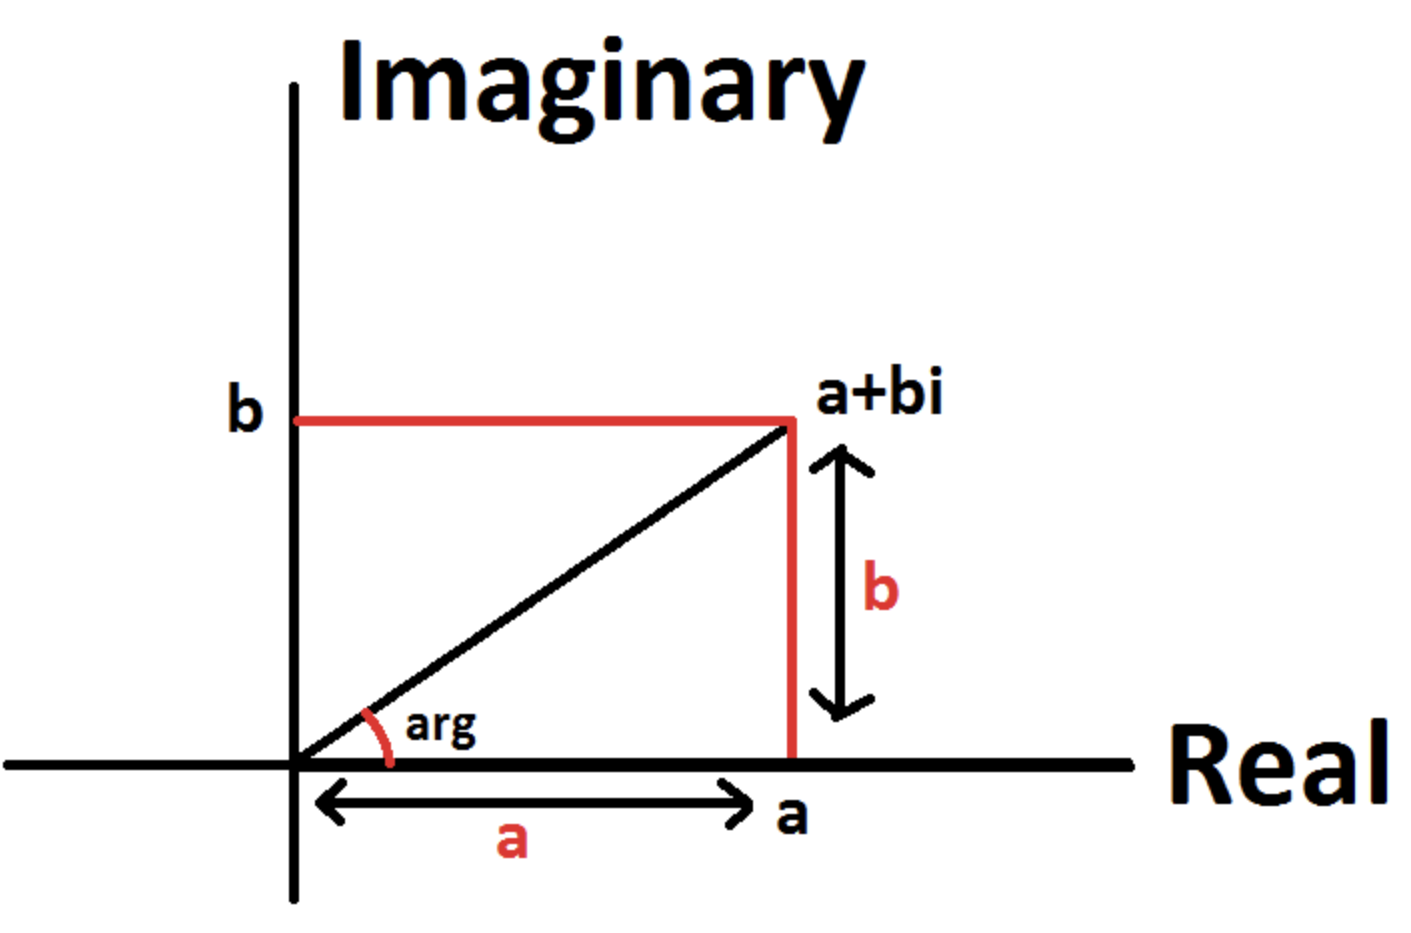
This setup makes perfect sense when you think about the structure of complex numbers. Since every complex number has the form , where is the real part and is the imaginary coefficient, we can represent it as a point with coordinates .
How to plot complex numbers
To plot a complex number on the Argand diagram, follow these systematic steps:
- Identify the real part () - this gives you the horizontal position
- Identify the imaginary coefficient () - this gives you the vertical position
- Plot the point at coordinates
Key Insight: The plotting process is identical to plotting regular coordinate pairs, but the meaning is different. Instead of x and y coordinates, we're plotting the real and imaginary components of a complex number.
For example, the complex number would be plotted at the point because:
- Real part = 3 (move 3 units along the real axis)
- Imaginary coefficient = 2 (move 2 units up the imaginary axis)
Worked examples
Worked Example: Plotting Complex Numbers on the Argand Diagram
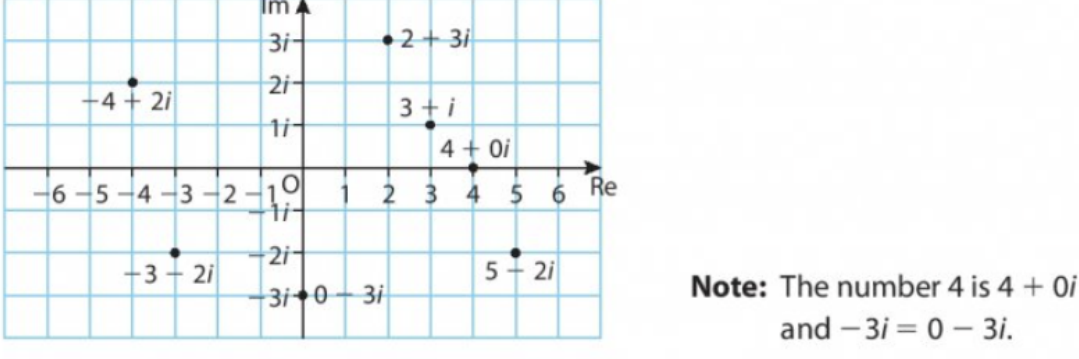
Let's examine several complex numbers and see how they appear on the Argand diagram:
Example 1:
- Real part: 2
- Imaginary part: 3
- Plot at point
Example 2:
- Real part: -4
- Imaginary part: 2
- Plot at point
Example 3:
- Real part: 5
- Imaginary part: -2
- Plot at point
Special cases to remember
Critical Special Cases for Exams
There are two important special cases that frequently appear in examinations:
Real numbers: A real number like 4 can be written as
- This plots on the real axis at point
- All real numbers lie on the horizontal axis
Pure imaginary numbers: A number like can be written as
- This plots on the imaginary axis at point
- All pure imaginary numbers lie on the vertical axis
These special positions make it easy to identify the nature of a complex number just by looking at its position on the diagram.
Exam tips
Essential Exam Strategies
- Always write complex numbers in standard form () before plotting
- Check your signs carefully - negative values move left (real axis) or down (imaginary axis)
- Remember that real numbers have zero imaginary part and plot on the real axis
- Pure imaginary numbers have zero real part and plot on the imaginary axis
- Label your axes clearly as "Re" and "Im" in exam answers
- Show your working by clearly identifying the real and imaginary parts before plotting
Key Points to Remember:
- The Argand diagram is a coordinate system specifically designed for plotting complex numbers
- The horizontal axis is the real axis (Re) and shows the real parts of complex numbers
- The vertical axis is the imaginary axis (Im) and shows the imaginary coefficients
- Every complex number plots as the point
- Real numbers plot on the real axis, while pure imaginary numbers plot on the imaginary axis
- The diagram transforms abstract algebraic expressions into visual geometric representations