Empirical Rule (Leaving Cert Mathematics): Revision Notes
Empirical Rule
Overview
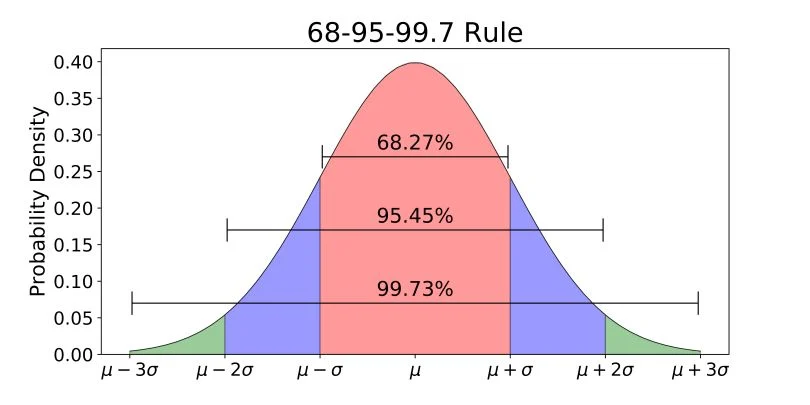
The Empirical Rule, also known as the 68-95-99.7 Rule, applies to bell-shaped, normal distributions. It provides a quick way to estimate the proportion of data that falls within one, two, or three standard deviations of the mean.
Key Proportions in the Empirical Rule
Within 1 Standard Deviation:
- Approximately 68% of the data falls within
Within 2 Standard Deviations:
- Approximately 95% of the data falls within
Within 3 Standard Deviations:
-
Approximately 99.7% of the data falls within Where:
-
: Mean of the data.
-
: Standard deviation.
Applications of the Empirical Rule
- Quick Estimation:
- Helps assess the spread and density of data in a normal distribution.
- Outlier Detection:
- Data points beyond are often considered outliers.
- Prediction:
- Used to predict probabilities in scenarios with normal distributions.
Worked Examples
Example 1: Height of Students
Problem: The heights of students are normally distributed with a mean of 170 cm and a standard deviation of 10 cm.
Estimate the percentage of students with heights between 160 cm and 180 cm.
Solution:
Step 1: Identify the range:
Step 2: Apply the Empirical Rule:
Approximately 68% of the data lies within one standard deviation of the mean.
Answer: About 68% of students have heights between 160 cm and 180 cm.
Example 2: Test Scores
Problem: A test has scores that are normally distributed with a mean of 50 and a standard deviation of 5.
What percentage of students scored between 40 and 60?
Solution:
Step 1: Identify the range:
Step 2: Apply the Empirical Rule:
Approximately 95% of the data lies within two standard deviations of the mean.
Answer: About 95% of students scored between 40 and 60.
Summary
- The Empirical Rule applies to normal distributions and is summarised as:
- 68% of the data falls within 1 standard deviation ().
- 95% of the data falls within 2 standard deviations ().
- 99.7% of the data falls within 3 standard deviations ().
- Useful for:
- Estimating probabilities in a normal distribution.
- Detecting outliers.
- Quick and practical for interpreting data sets with normal distributions.