Mass Defect, Binding Energy, and Nuclear Stability (Leaving Cert Physics): Revision Notes
Mass Defect, Binding Energy, and Nuclear Stability
What is mass defect?
When you examine the mass of any atomic nucleus, you'll discover something quite remarkable. If you add up the individual masses of all the protons and neutrons that make up the nucleus, the total will always be greater than the actual measured mass of the complete nucleus.
This "missing mass" is called the mass defect. It represents the difference between what we would expect the nucleus to weigh (based on its components) and what it actually weighs.
The deuterium example
Let's look at deuterium (²H), an isotope of hydrogen that contains one proton and one neutron:
Worked Example: Mass Defect Calculation for Deuterium
Individual particle masses:
- Mass of one proton = 1.672 × 10⁻²⁷ kg
- Mass of one neutron = 1.674 × 10⁻²⁷ kg
- Expected combined mass = 3.346 × 10⁻²⁷ kg
Actual measurement:
- Mass of deuterium nucleus = 3.344 × 10⁻²⁷ kg
Mass defect calculation: Mass defect = Expected mass - Actual mass = 3.346 × 10⁻²⁷ - 3.344 × 10⁻²⁷ = 2.014 × 10⁻³⁰ kg
This might seem like a tiny difference, but it has enormous consequences for nuclear energy.
Understanding binding energy
The mass defect isn't simply "lost" - it has been converted into energy according to Einstein's famous equation. This energy is called the binding energy of the nucleus.
The mass-energy relationship
Einstein showed us that mass and energy are interchangeable through the relationship:
The binding energy of any nucleus equals its mass defect multiplied by the square of the speed of light:
Binding Energy = Mass defect × c²
Where c = 3.0 × 10⁸ m/s (speed of light in a vacuum)
Worked Example: Binding Energy for Deuterium
For our deuterium example: Binding Energy = 2.014 × 10⁻³⁰ × (3.0 × 10⁸)² = 1.81 × 10⁻¹³ J
What binding energy represents
The binding energy tells us several important things:
- Formation energy: This is the energy that was released when the individual protons and neutrons came together to form the nucleus
- Separation energy: This is the minimum energy you would need to supply to completely break the nucleus apart into individual nucleons
- Stability measure: Higher binding energy means the nucleus is more stable and harder to break apart
Nuclear stability and the binding energy curve
Not all atomic nuclei are equally stable. To understand nuclear stability patterns, physicists plot the binding energy per nucleon (binding energy ÷ number of nucleons) against the mass number.
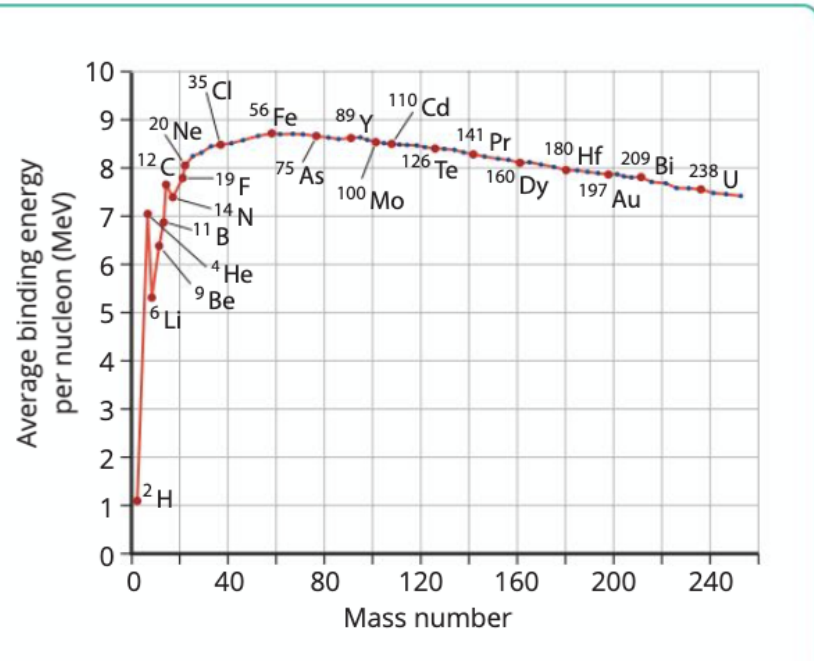
This curve reveals several crucial insights about nuclear stability:
Key features of the stability curve
Light elements (left side of curve):
- Have relatively low binding energy per nucleon
- Can increase their stability by combining with other light nuclei
- This process is called nuclear fusion
- Examples include hydrogen, helium, and lithium isotopes
Iron region (peak around mass 56):
- Shows the highest binding energy per nucleon (approximately 8.8 MeV)
- Represents the most stable nuclei in nature
- Iron-56 is often considered the most stable nucleus of all
Heavy elements (right side of curve):
- Have lower binding energy per nucleon compared to iron
- Can increase their stability by splitting into smaller nuclei
- This process is called nuclear fission
- Examples include uranium and plutonium isotopes
Energy release in nuclear reactions
This stability curve explains why both nuclear fusion and nuclear fission can release tremendous amounts of energy:
Nuclear fusion: Light nuclei combine to form heavier, more stable nuclei. The products have higher binding energy per nucleon than the reactants, so energy is released.
Nuclear fission: Heavy nuclei split into lighter fragments that are closer to the stability peak. Again, the products are more stable than the original nucleus, releasing energy.
Worked example: Copper-63 binding energy
Worked Example: Calculating Binding Energy for Copper-63
Copper-63 has 29 protons and 34 neutrons:
Step 1: Calculate total mass of separated nucleons
- Mass of 29 protons: 29 × 1.672 × 10⁻²⁷ kg = 4.849 × 10⁻²⁶ kg
- Mass of 34 neutrons: 34 × 1.674 × 10⁻²⁷ kg = 5.692 × 10⁻²⁶ kg
- Total nucleon mass: 1.054 × 10⁻²⁵ kg
Step 2: Find the mass defect
- Actual Cu-63 nucleus mass: 1.044 × 10⁻²⁵ kg
- Mass defect: 1.054 × 10⁻²⁵ - 1.044 × 10⁻²⁵ = 9.83 × 10⁻²⁸ kg
Step 3: Calculate binding energy using E = mc²
- Binding energy = 9.83 × 10⁻²⁸ × (3.0 × 10⁸)²
- Binding energy = 8.83 × 10⁻¹¹ J
Important conversions and constants
When working with nuclear masses, you'll often encounter atomic mass units (u):
Key conversion: 1 u = 1.661 × 10⁻²⁷ kg
Standard particle masses:
- Proton: 1.672 × 10⁻²⁷ kg
- Neutron: 1.674 × 10⁻²⁷ kg
- Speed of light: c = 3.0 × 10⁸ m/s
Exam tips for nuclear calculations
Key Points to Remember:
-
Check your units carefully - make sure all masses are in kilogrammes before using
-
Remember the mass defect is always positive - the nucleus mass is always less than the sum of its parts
-
Use the correct value for c - always use 3.0 × 10⁸ m/s in calculations
-
Binding energy increases with stability - more stable nuclei have higher binding energies
-
Iron-56 is the stability champion - it sits at the peak of the binding energy curve
Essential Concepts Summary:
- Mass defect is the difference between the calculated mass of separated nucleons and the actual nucleus mass
- Binding energy equals the mass defect times and represents the energy holding the nucleus together
- Iron-56 has maximum binding energy per nucleon, making it the most stable nucleus
- Nuclear fusion releases energy for light elements moving towards iron on the stability curve
- Nuclear fission releases energy for heavy elements breaking down towards the iron region
- Both processes work because they create more stable nuclei with higher binding energy per nucleon