Displacement-Time Graphs (Leaving Cert Physics): Revision Notes
Displacement-Time Graphs
Displacement-time graphs are essential tools in physics that help us understand and analyse the motion of objects. These graphs show how an object's position changes over time and provide valuable information about velocity and direction of movement.
What are displacement-time graphs?
A displacement-time graph plots an object's displacement (position relative to a reference point) against time. Unlike distance-time graphs, displacement-time graphs can show negative values, indicating the object has moved to the opposite side of the reference point.
The key difference from distance-time graphs is that displacement can be negative, showing direction as well as magnitude of movement.
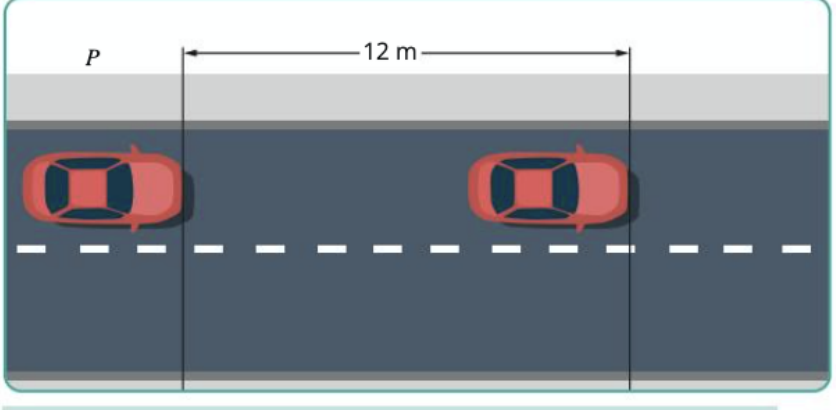
In the example above, we can see two cars separated by 12 metres, which helps us understand the concept of displacement from a reference point.
Understanding displacement and reference points
When we measure displacement, we need a reference point (often called the origin). The displacement can be:
Understanding Position Relative to Reference Points:
- Positive: when the object is to the right of the reference point
- Negative: when the object is to the left of the reference point
- Zero: when the object is exactly at the reference point
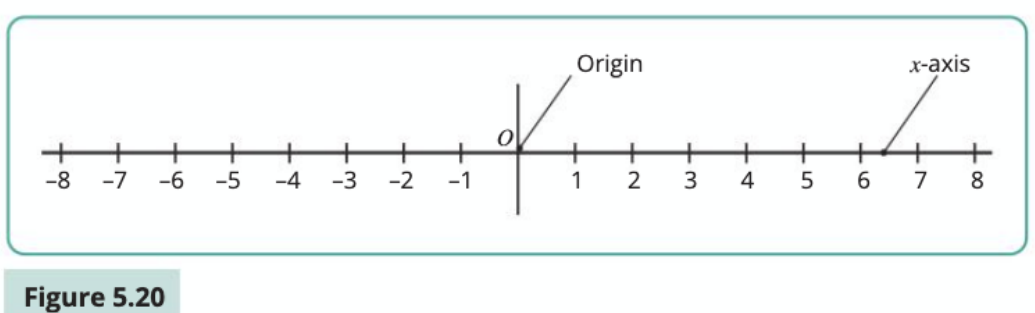
This number line shows how positive and negative positions work relative to the origin (0).
Reading displacement-time graphs
Let's look at some example data to understand how these graphs work:
| Time (s) | 0 | 1 | 2 | 3 | 4 | 5 | 6 | 7 |
|---|---|---|---|---|---|---|---|---|
| Distance east of P (m) | 0 | 3 | 6 | 9 | 12 | 15 | 18 | 21 |
When this data is plotted on a graph, it creates a straight line that passes through the origin:
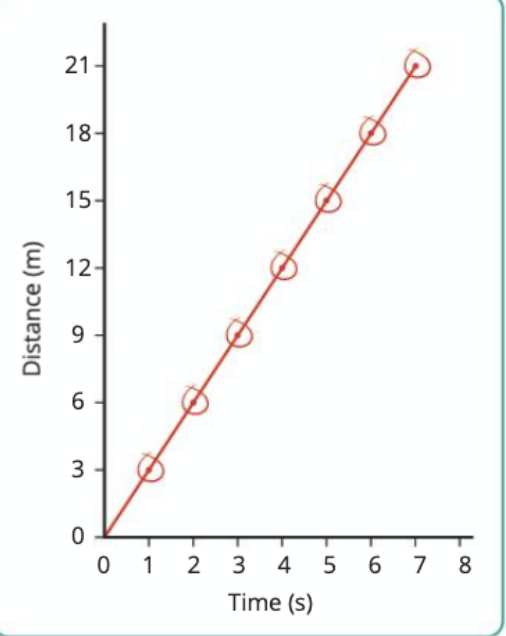
What This Straight Line Tells Us:
This straight line tells us several important things:
- The object starts at the reference point (position 0)
- It moves at a constant velocity
- The motion is uniform (steady speed in one direction)
The slope equals velocity
The most important concept with displacement-time graphs is that the slope of the line equals the velocity of the object.
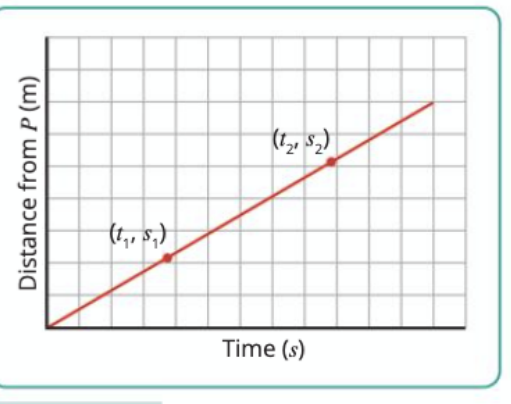
To calculate the slope (and therefore the velocity), we use:
Where:
- and are displacements at different times
- and are the corresponding times
This gives us the average velocity over that time period:
Interpreting different slopes
Different slopes on displacement-time graphs tell us different things about the object's motion:
Slope Interpretation Guide:
- Zero slope (horizontal line): Object is stationary
- Positive slope: Object is moving in the positive direction (e.g., to the right)
- Negative slope: Object is moving in the negative direction (e.g., to the left)
- Steeper slope: Object is moving faster
- Gentler slope: Object is moving more slowly
- Changing slope: Object's velocity is changing
Complex motion patterns
Real objects don't always move in straight lines at constant velocity. Here's an example of more complex motion:
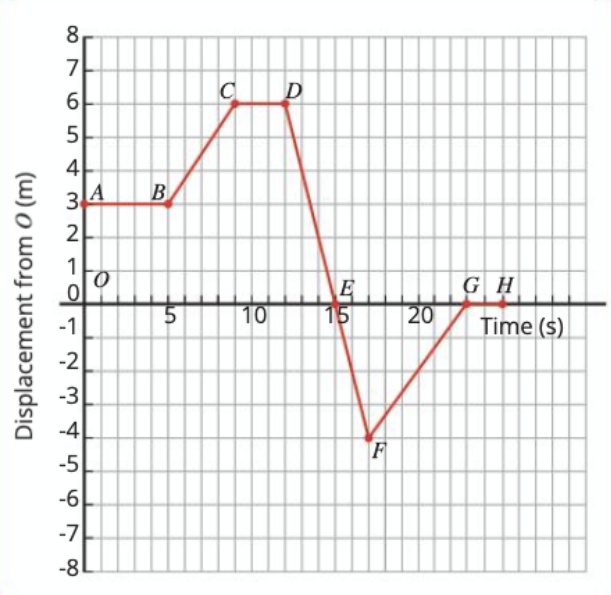
This graph shows an object's displacement over 25 seconds with several different phases:
- Periods of rest (horizontal sections)
- Movement in different directions
- Changes in speed and direction
Each section of this graph tells us something different about the object's motion at that time.
Curved displacement-time graphs
When an object's velocity is changing (acceleration), the displacement-time graph becomes curved rather than straight:
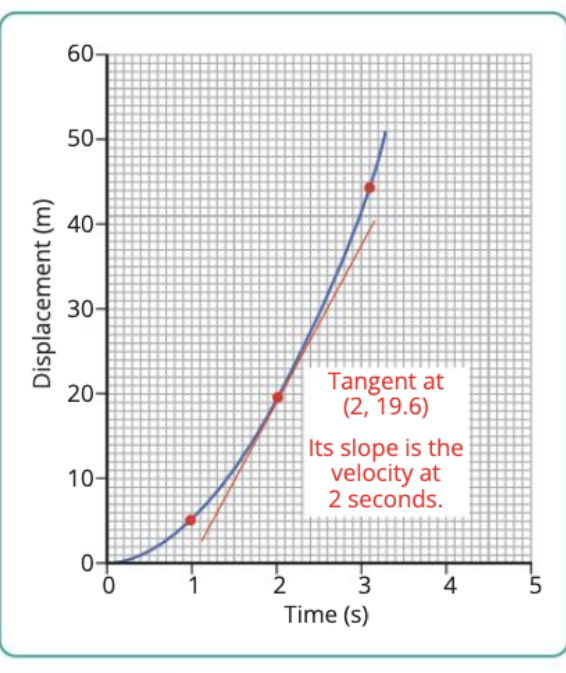
For curved graphs:
- The slope of the tangent line at any point gives the instantaneous velocity at that moment
- A steeper curve indicates greater acceleration
- The overall shape tells us about the type of motion (e.g., constant acceleration creates a parabolic curve)
Practical applications
Understanding displacement-time graphs is crucial for:
- Analysing vehicle motion and traffic flow
- Studying projectile motion
- Understanding oscillations and waves
- Solving kinematics problems in exams
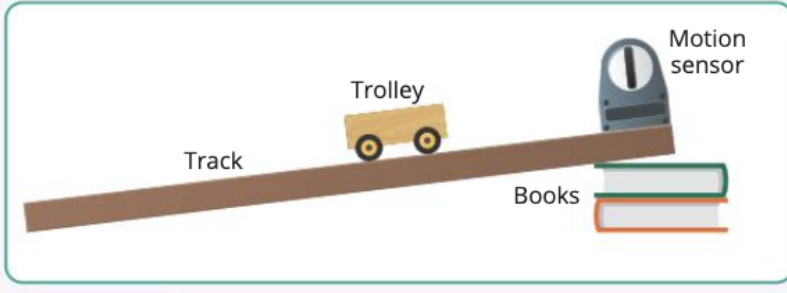
Experiments using trolleys on inclined planes (shown above) are common ways to collect data for creating these graphs in the laboratory.
Worked example interpretation
Worked Example: Interpreting Complex Motion
Let's examine a practical example of interpreting a displacement-time graph:
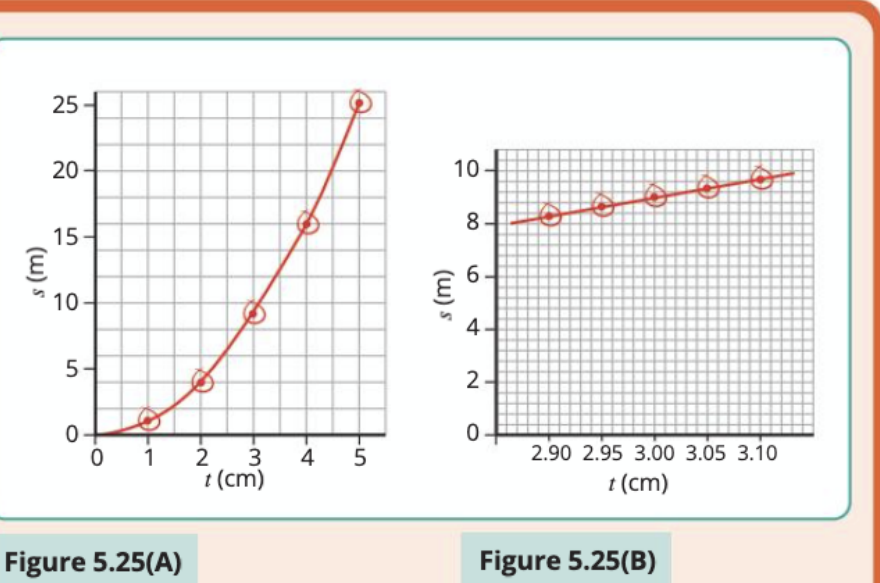
These graphs show both the overall motion pattern and a zoomed-in section that reveals more detail about the relationship between variables. The linear section (right graph) makes it easier to calculate precise velocity values.
Key Points to Remember:
- Displacement-time graphs show position relative to a reference point over time
- The slope of a displacement-time graph equals the velocity
- Positive slopes indicate motion in one direction, negative slopes indicate motion in the opposite direction
- Horizontal lines mean the object is stationary
- For curved graphs, draw a tangent line to find instantaneous velocity at any point