Ways of Representing Business Cycles (Grade 10 NSC Matric Economics): Revision Notes
Ways of Representing Business Cycles
Understanding time series
A time series is a method economists use to collect and analyse economic data that is measured at regular intervals. These intervals can be weekly, monthly, quarterly, or yearly, depending on what information is being tracked.
Two important examples of time series that help us understand business cycles are:
- Consumer Price Index (CPI) - tracks changes in the cost of living
- Real Gross Domestic Product (GDP) - measures the total value of goods and services produced
The word "real" in economic terms means that the effects of inflation have been removed from the data. This allows economists to make meaningful comparisons between different time periods without inflation distorting the results.
Cyclical patterns in the economy
Business cycles represent the natural pattern of economic ups and downs that occur in every economy. These cycles follow a continuous pattern, but each cycle is unique - some are long, others are short, and some show dramatic differences between high and low points.
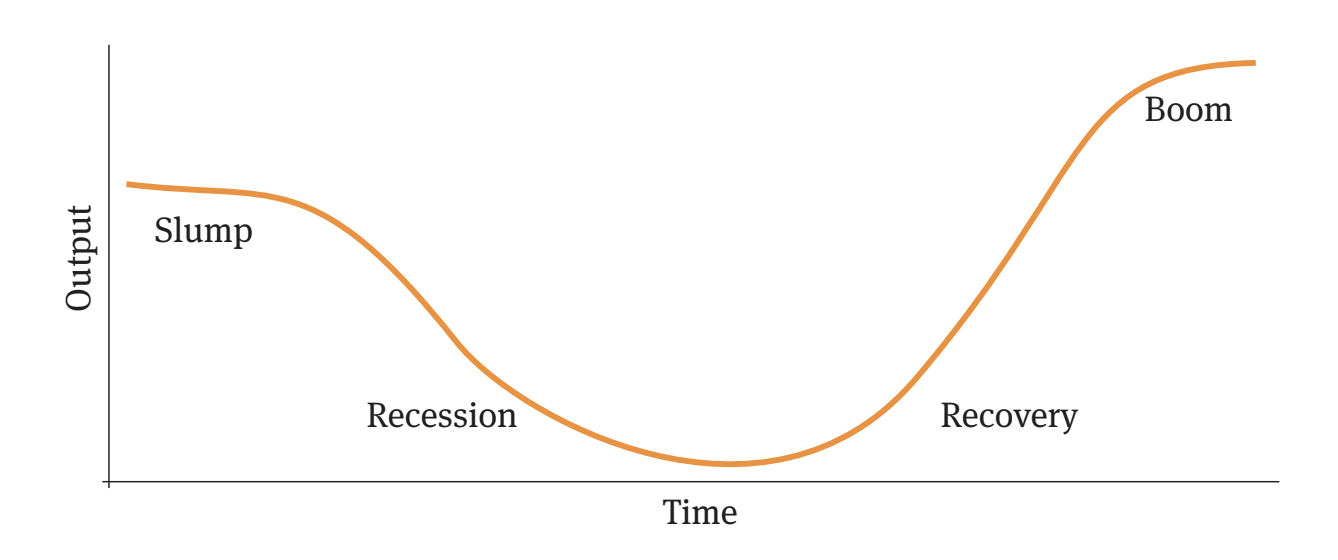
The business cycle consists of four main phases: prosperity, recession, depression, and recovery. These phases can also be grouped into two main periods:
- Expansion (upswing): includes recovery and prosperity phases
- Contraction (downswing): includes recession and depression phases
Each business cycle is unique in duration and intensity, but they all follow the same general pattern of expansion followed by contraction. Understanding these patterns helps economists and policymakers prepare for and respond to economic changes.
The prosperity phase
During the prosperity phase, the economy experiences significant growth and improvement across all sectors. This phase creates a positive feedback loop where increased economic activity leads to even more growth.
Economic Indicators During Prosperity:
Official Definition: Prosperity is official when the economy has grown for a period of six consecutive months.
Key Effects:
- Economic activity increases throughout the country
- Output, employment rates, and wages all rise
- People's standard of living improves
- The phase continues until the economy reaches its peak
What happens during prosperity:
Consumption: People have more money to spend, which increases the overall demand for goods and services. This higher spending drives economic growth by encouraging businesses to produce more.
Real GDP: As demand increases, businesses earn more profits and attract new entrepreneurs to enter markets. This leads to increased production, which raises real GDP and signals economic growth.
Investment: To meet growing demand, businesses increase their investment in three main areas:
- Buildings: Companies buy, build, or rent new facilities and may open branches in new locations
- Machinery: Businesses purchase more equipment to produce larger quantities of goods and services
- Inventories: Stock levels increase to satisfy the higher demand from consumers
Employment: The increased demand for goods creates more jobs as businesses need additional workers to increase production. People who were previously unemployed often find work during this phase.
Prices and other economic factors:
- Consumer Price Index: When total demand exceeds total supply, shortages occur, leading to price increases and inflation
- Exchange rates: Higher demand for our products from other countries strengthens our currency
- Interest rates: These typically increase during prosperity due to higher demand for capital
- Wages: Real GDP per capita growth leads to wage increases and improved living standards
The recession phase
Economic downturns are a natural part of the business cycle, and understanding recession characteristics helps us recognize when the economy enters this challenging phase.
Defining a Recession:
A recession occurs when economic growth declines for two consecutive quarters. This represents a significant shift from the prosperity phase, with measurable impacts across all economic sectors.
Key Characteristics:
- Economic growth decreases or becomes negative
- Business output falls
- Employment rates drop as workers are laid off
- People's incomes decrease
- The recession ends when the economy reaches its lowest point (the trough)
What happens during recession:
Consumption: People have less money available to spend, which reduces aggregate demand throughout the economy.
Real GDP: The quantity of goods and services produced falls due to decreased demand. As output decreases, real GDP also falls, indicating economic contraction.
Investment: Businesses reduce their investment spending and may close some operations. With lower demand, there's no incentive to increase capacity.
Employment: Declining demand forces businesses to reduce output and lay off workers. Unemployment rates increase, and people's standard of living decreases.
Prices and economic factors:
- Consumer Price Index: Decreased demand leads to falling prices, reducing the CPI
- Exchange rates: Lower foreign demand for our goods weakens our currency against other currencies
- Interest rates: These typically fall, and central banks may reduce rates to stimulate economic activity
- Wages: Businesses may reduce wages or dismiss workers to cut production costs
Depression
When a recession continues for an extended period, it becomes a depression. Depression represents a severe form of recession characterised by:
- Large-scale unemployment
- Severe shortages of goods and services
- Prolonged economic decline
Depressions are relatively rare because governments typically intervene to prevent recessions from becoming depressions. The most famous example was the Great Depression of 1933 in the Western world.
Recovery phase
The recovery phase marks the beginning of economic improvement after a recession or depression. This phase represents hope and renewed economic activity as various indicators begin to show positive trends.
During this phase:
- The economy starts to grow again
- Recovery usually begins slowly and gradually speeds up over time
- There's a gradual increase in demand and output
- Eventually, recovery leads back to prosperity
Recovery can be slow and uneven across different sectors of the economy. Some industries may recover faster than others, and it may take time for employment levels to return to pre-recession levels.
Turning points in business cycles
Business cycles have two critical turning points that mark transitions between phases. These turning points are crucial for economists and policymakers to identify and understand.
Peak - The Upper Turning Point
The peak represents the highest point of economic activity. At this point:
- The economy operates at full employment
- Production occurs at full capacity
- Economic activity reaches its maximum before beginning to decline
- This marks the upper turning point of the cycle
Trough - The Lower Turning Point
The trough represents the lowest point of economic activity. At this point:
- Economic decline stops and begins to reverse
- This marks the end of a recession or depression
- Recovery begins from this point
- This represents the lower turning point of the cycle
Measuring business cycles
Accurate measurement of business cycles requires sophisticated data collection and analysis systems. Economists use multiple indicators to get a complete picture of economic performance.
The dating system
The National Bureau of Economic Research (NBER) uses a dating system to measure and track business cycles. They collect statistics daily, weekly, and monthly, then compile quarterly reports. Only quarterly statistics are used for final business cycle analysis.
Key economic indicators
Gross Domestic Product: GDP serves as a crucial measure of the economy's overall health and performance.
Employment growth rate: Statistics track how many people are employed and monitor changes in employment levels over time.
Inflation rate: The South African Reserve Bank compiles inflation data, which provides important insights into where the economy stands in the business cycle.
Production indicators: Specific production figures, such as new building construction and gold mining output, help indicate the economy's current cycle position.
Key Points to Remember:
- Business cycles follow predictable patterns with four phases: prosperity, recession, depression, and recovery
- Time series data helps economists track and measure these cycles using regular intervals
- Real data removes inflation effects to provide accurate comparisons across time periods
- The two turning points (peak and trough) mark critical transitions in the cycle
- Multiple economic indicators work together to provide a complete picture of where the economy stands in its cycle
- Prosperity is official after six consecutive months of growth
- Recession is defined as two consecutive quarters of economic decline