Maximising Satisfaction – Indifference Curves (Grade 10 NSC Matric Economics): Revision Notes
Maximising Satisfaction – Indifference Curves
What are indifference curves?
An indifference curve is a useful economic tool that helps us understand how consumers make choices between different goods. Think of it as a line on a graph that connects all the different combinations of two products that would make you equally happy or satisfied.
The concept of indifference curves was developed by economist Francis Ysidro Edgeworth in the 1880s and later refined by Vilfredo Pareto. This tool has become fundamental to modern consumer choice theory and helps explain real-world purchasing decisions.
The key idea is simple: if you're equally happy with different combinations of goods, then you are "indifferent" between these choices - hence the name "indifference curve."
Understanding the basic indifference curve
Let's look at how an indifference curve appears on a graph:
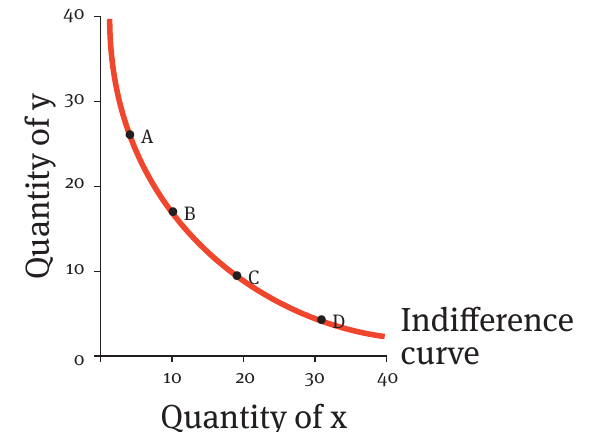
This graph shows us several important features:
- The axes: The horizontal axis shows the quantity of good x, while the vertical axis shows the quantity of good y
- The curve shape: Notice how the curve slopes downward from left to right and is curved (convex) towards the origin
- Points on the curve: Points A, B, C, and D all represent different combinations of goods x and y that provide the same level of satisfaction
How indifference curves show equal satisfaction
The fascinating thing about indifference curves is that every point along the same curve represents combinations that make the consumer equally happy.
Reading an Indifference Curve:
Looking at the graph above:
- At point A, you might have 8 units of good y and 2 units of good x
- At point D, you might have 2 units of good y and 10 units of good x
- Despite these different combinations, both points provide exactly the same level of satisfaction to the consumer
This means you would be completely indifferent about choosing between these two combinations!
For example:
- At point A, you have more of good y but less of good x
- At point D, you have much more of good x but very little of good y
- Despite these different combinations, you would be equally satisfied with either choice
This demonstrates the concept of trade-offs in consumer choice. To get more of one good, you must give up some of the other good, but your overall satisfaction remains the same.
Changes in income and consumer choices
Your income level significantly affects what combinations of goods you can afford. Here's how income changes impact your choices:
- Original income: With your current income, you can choose combinations along a specific indifference curve
- Income increase: When your income rises, you can afford more of both goods, allowing you to move to a higher indifference curve with greater satisfaction
- Income decrease: If your income falls, you can afford less of both goods and must move to a lower indifference curve
- Price changes: When the price of goods changes, the slope of your options also changes, affecting which combinations you can choose
Multiple indifference curves and utility levels
Consumers don't just have one indifference curve - they have many, representing different levels of satisfaction:
Understanding Multiple Indifference Curves:
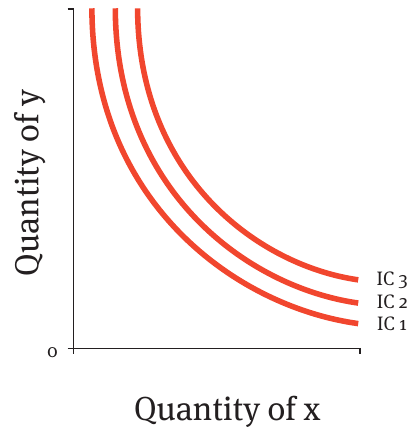
The relationship between indifference curves and satisfaction levels is crucial to understand. The further an indifference curve is from the origin, the higher the level of satisfaction it represents. This is because curves further out represent combinations with more of both goods, which logically provides greater utility to the consumer.
This diagram shows three different indifference curves:
- IC₁ (closest to origin): Represents the lowest level of satisfaction
- IC₂ (middle curve): Shows a moderate level of satisfaction
- IC₃ (farthest from origin): Indicates the highest level of satisfaction
Key characteristics of indifference curves
Essential Properties of Indifference Curves:
Understanding these properties is crucial for correctly interpreting and using indifference curves in economic analysis:
- Downward sloping: As you increase one good, you must decrease the other to maintain the same satisfaction level
- Convex shape: The curve bows inward toward the origin, reflecting the principle of diminishing marginal rate of substitution
- Never intersect: Two indifference curves representing different satisfaction levels cannot cross each other
- Higher curves mean higher satisfaction: The further from the origin, the better off the consumer
Why the convex shape matters: This reflects that as you have more and more of one good, you're willing to give up less and less of the other good to get even more of the first good.
Practical applications
Indifference curves help economists and businesses understand:
- How consumers make choices between different products
- Why people with the same income might make different purchasing decisions
- How changes in income affect spending patterns
- The impact of price changes on consumer behaviour
These insights are valuable for businesses when setting prices, designing product bundles, and understanding market segments. Government policymakers also use these concepts when analysing the effects of taxation and subsidies on consumer welfare.
Key Points to Remember:
- Indifference curves show combinations of goods that provide equal satisfaction to consumers
- All points on the same curve represent equally preferred combinations
- Higher indifference curves (further from origin) represent higher levels of satisfaction
- Income changes allow consumers to move between different indifference curves
- The curved shape reflects the trade-offs consumers are willing to make between different goods
- These curves never intersect and are always downward sloping and convex to the origin