Measures of Central Tendency (Grade 10 NSC Matric Mathematics): Revision Notes
Measures of Central Tendency
Measures of central tendency help us find a single value that represents the centre or typical value of a data set. There are three main measures you need to know for your NSC exam: mean, median, and mode.
Mean
Definition: The mean is the sum of all values in a data set divided by the number of values. The mean is also called the average or arithmetic mean.
The formula for calculating the mean is:
Where:
- represents the mean
- is the number of values in the data set
- represents each individual value
How to calculate the mean
Follow these simple steps:
- Add up all the values in your data set
- Count how many values you have
- Divide the sum by the number of values
Worked Example: Calculating the mean
Question: What is the mean of the data set {10; 20; 30; 40; 50}?
Solution:
Step 1: Calculate the sum of the data
10 + 20 + 30 + 40 + 50 = 150
Step 2: Divide by the number of values in the data set
Since there are 5 values in the data set: mean =
Median
Definition: The median is the value in the central position when the data set has been arranged from lowest to highest value.
An important property of the median is that exactly half of the values are less than the median and the other half are greater than the median.
How to find the median
- Sort the data from smallest to largest value
- Find the middle value:
- If there is an odd number of values: the median equals the middle value
- If there is an even number of values: the median is halfway between the two middle values
Worked Example: Median with odd number of values
Question: What is the median of {10; 14; 86; 2; 68; 99; 1}?
Solution:
Step 1: Sort the values
Arranged from smallest to largest: 1; 2; 10; 14; 68; 86; 99
Step 2: Find the number in the middle
There are 7 values in the data set. Since this is an odd number, the median equals the value in the middle position (4th position).
Therefore, the median = 14
Worked Example: Median with even number of values
Question: What is the median of {11; 10; 14; 86; 2; 68; 99; 1}?
Solution:
Step 1: Sort the values
Arranged from smallest to largest: 1; 2; 10; 11; 14; 68; 86; 99
Step 2: Find the number in the middle
There are 8 values in the data set. Since this is an even number, the median lies halfway between the two middle values (4th and 5th positions).
The 4th position is 11 and the 5th position is 14.
Median =
Mode
Definition: The mode is the value that occurs most often in the data set. It can also be described as the most frequent or most common value.
How to find the mode
- Count how many times each value appears in the data set
- Identify the value that appears most often
Important notes about mode:
- A data set can have more than one mode if multiple values have the highest frequency
- If all values occur with equal frequency, the data set has no mode
- The mode is particularly useful for qualitative data (categories)
Worked Example: Finding the mode
Question: Find the mode of {2; 2; 3; 4; 4; 4; 6; 6; 7; 8; 8; 10; 10}
Solution:
Step 1: Count how many times each value appears
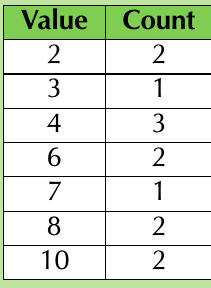
Step 2: Find the value that appears most often
From counting, we can see that 4 appears 3 times, which is more than any other value.
Therefore, the mode = 4
Comparison of the three measures
When comparing mean, median, and mode, it's important to understand their different characteristics:
Key Characteristics:
- Mean: Uses all values in the calculation, so it's affected by extremely high or low values (outliers)
- Median: Only depends on the middle value(s), so it's less affected by outliers
- Mode: Shows the most common value, useful for understanding what's typical
Real-world example
Consider this data showing bread masses measured over a week:
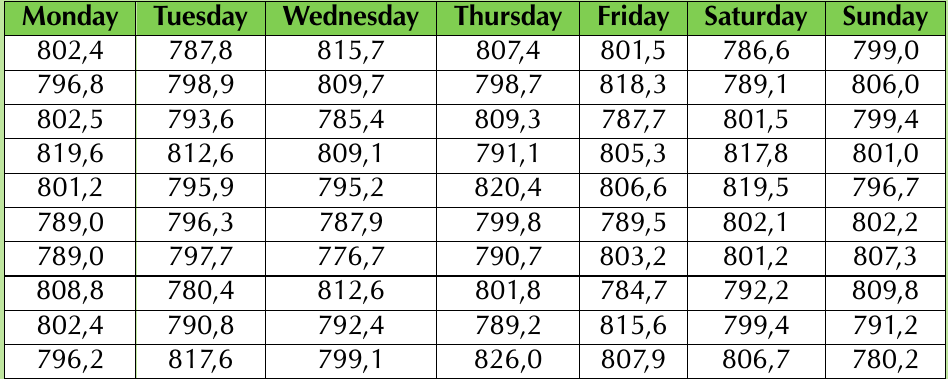
For each day, we can calculate all three measures:
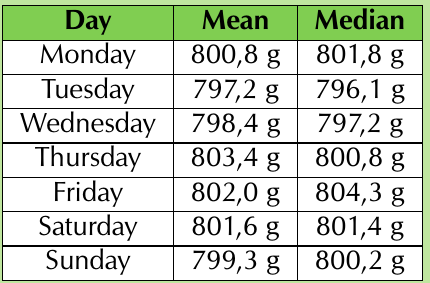
Notice how the mean and median values are close to each other but not exactly equal. This is common with real data sets.
Effect of outliers
Definition: An outlier is a value in the data set that is not typical of the rest of the set. It is usually much greater or much less than all other values.
How outliers affect measures of central tendency
Critical Impact of Outliers:
The mean is significantly affected by outliers because it includes all values in its calculation.
The median is less affected by outliers because it only depends on the middle position(s).
Worked Example: Effect of outliers
Question: Compare the mean and median of learners' heights before and after including an exceptionally tall learner.
Original data (10 learners): {150; 172; 153; 156; 146; 157; 157; 143; 168; 157}
After adding outlier: {150; 172; 153; 156; 146; 157; 157; 143; 168; 157; 181}
Solution:
Original mean = cm
New mean = cm
Change in mean = 158.2 - 155.9 = 2.3 cm
Original median = 156.5 cm (average of 5th and 6th values when sorted)
New median = 157 cm (6th value when 11 values are sorted)
Change in median = 157 - 156.5 = 0.5 cm
Conclusion: The mean changed by 2.3 cm while the median only changed by 0.5 cm. This shows that the median is less affected by outliers than the mean.
Exam Tips:
- Always sort your data before finding the median
- Check your arithmetic when calculating the mean
- For mode questions, create a frequency table to count values systematically
- Remember that continuous data (like measurements) rarely has a clear mode
- When data contains outliers, the median often gives a better representation of the centre than the mean
Key Points to Remember:
- Mean: Add all values and divide by the count - affected by outliers
- Median: The middle value when data is sorted - less affected by outliers
- Mode: The most frequently occurring value - useful for categorical data
- Always sort data before finding the median
- The mean uses all data values, while median only uses position