Summarising Data (Grade 11 NSC Matric Mathematical Literacy): Revision Notes
Summarising Data
What is summarising data?
When working with data sets, we need ways to describe and understand the information quickly. Summarising data means finding representative values that give us an idea of what the data looks like overall. There are two main types of measures we use:
- Measures of central tendency - tell us about the "centre" or typical value
- Measures of spread - tell us how scattered or grouped the data values are
Understanding these different types of measures is essential for interpreting data correctly. Each type serves a specific purpose in helping us make sense of numerical information.
Measures of central tendency
Central tendency refers to finding a single value that represents the centre or average of a data set. This value should be representative of most values in the data set. There are three main measures:
Mean
Definition: The mean is the arithmetic average of all values in a data set.
Formula:
When to use: The mean works best when data values are grouped closely together and there are no extreme outliers.
Limitation: The mean can be heavily influenced by outliers (extremely high or low values), making it unrealistic as an average. Always check for outliers before relying on the mean!
Median
Definition: The median is the middle value when all data values are arranged in ascending or descending order.
How to find:
- If there is an odd number of values: the median is the middle value
- If there is an even number of values: the median is the average of the two middle values
When to use: The median is most accurate when data is grouped closely together, and it's particularly useful when there are outliers present.
Advantage: The median is not affected by outliers, making it more reliable than the mean in some situations. This is why house prices are often reported using median rather than mean values.
Mode
Definition: The mode is the value that occurs most frequently in a data set.
When to use: The mode is especially useful when you want to know the most common or popular item, such as in sales figures or preference surveys.
Limitation: Just because a value occurs most often doesn't mean it represents the majority of values in the data set.
Measures of spread
Understanding how spread out your data is can be just as important as knowing the central value.
Range
Definition: The range shows how spread out the values in a data set are.
Formula:
When to use: The range is most useful when there are no outliers in the data set.
Limitation: If there are outliers, the range can appear unrealistically large or small, giving a false impression of how grouped or spread out the values really are.
Choosing the right measure
The key to summarising data effectively is choosing the most appropriate measure for your situation. Here's a simple rule:
Calculate all measures (mean, median, mode) and compare them to see which gives the best representation of your data.
Consider these factors:
- Are there any outliers in your data?
- What type of information are you trying to communicate?
- What would be most useful for your audience?
Worked examples
Worked Example 1: School fees analysis
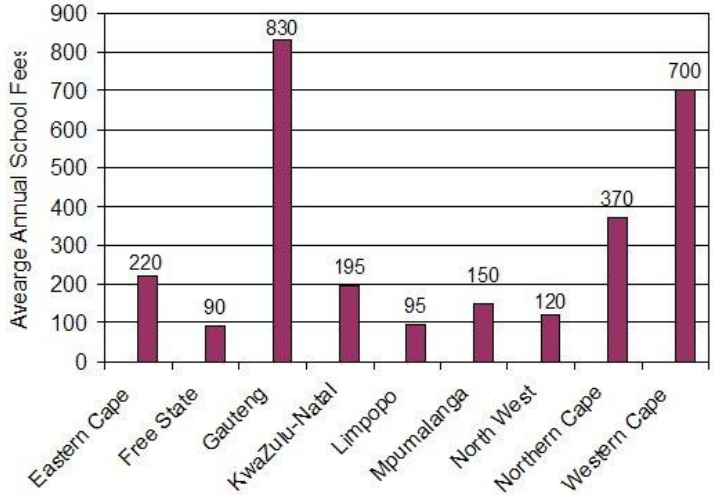
Let's calculate the mean annual school fees across South African provinces:
Step 1: Add all the values
Step 2: Divide by the number of provinces (9)
The mean annual school fee is R307.78.
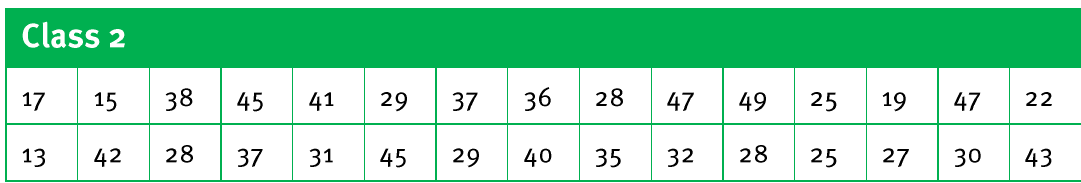
Worked Example 2: Comparing class test scores
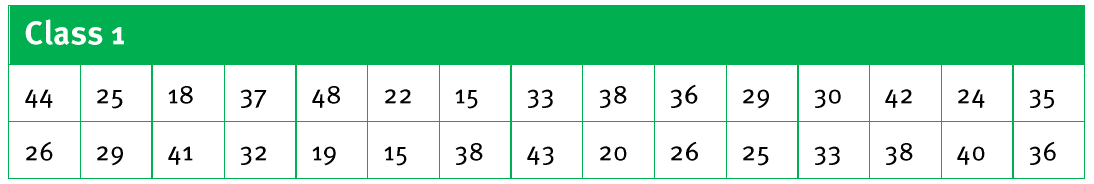
Class 1 scores: 44, 25, 18, 37, 48, 22, 15, 33, 38, 36, 29, 30, 42, 24, 35, 26, 29, 41, 32, 19, 15, 38, 43, 20, 26, 25, 33, 38, 40, 36
Class 2 scores: 17, 15, 38, 45, 41, 29, 37, 36, 28, 47, 49, 25, 19, 47, 22, 13, 42, 28, 37, 31, 45, 29, 40, 35, 32, 28, 25, 27, 30, 43
Calculating the means:
-
Class 1: marks
-
Class 2: marks
As percentages:
- Class 1:
- Class 2:
Conclusion: Class 2 performed better with a higher average.
Worked Example 3: Worker wages analysis
Data: R250, R275, R200, R520, R260, R250, R250, R260, R200, R240
Calculating all measures:
Mean:
Median: First arrange in order: R200, R200, R240, R250, R250, R250, R260, R260, R275, R520 Median =
Mode: R250.00 (appears 3 times)
Range: R520 - R200 = R320
Analysis: The median and mode (both R250) give a more realistic average because the mean is distorted by the outlier (R520). Most workers earn around R250, making the median and mode more representative.
Worked Example 4: Food preferences survey
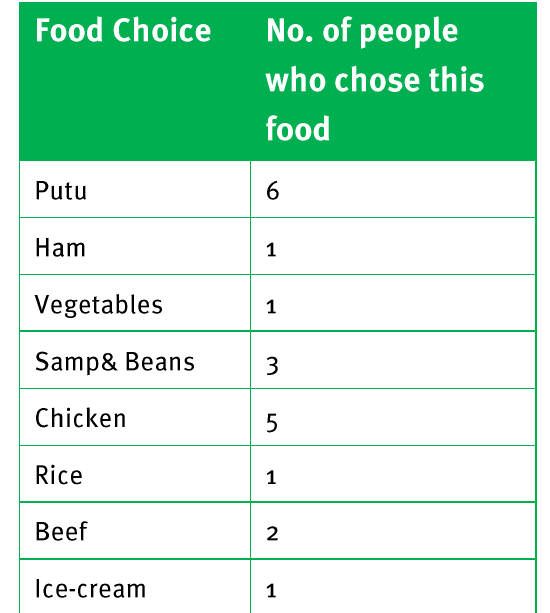
When Mrs Ntuli wants to determine the most popular food choice, she should use the mode because:
- It shows the most frequently chosen option
- Mean and median cannot be calculated for categorical data like food preferences
Result: Putu is the most popular choice (6 people), followed by Chicken (5 people) and Samp & Beans (3 people).
Worked Example 5: Teacher distribution analysis
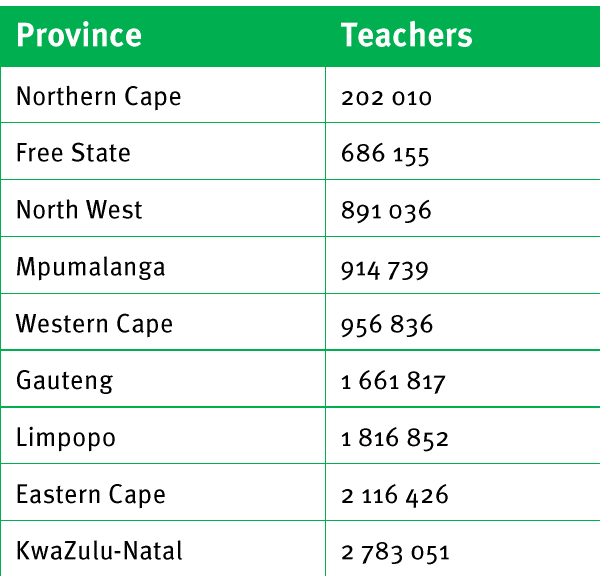
Mean number of teachers: teachers per province
Finding the median: Arrange provinces by teacher numbers: Northern Cape (202,010), Free State (686,155), North West (891,036), Mpumalanga (914,739), Western Cape (956,836), Gauteng (1,661,817), Limpopo (1,816,852), Eastern Cape (2,116,426), KwaZulu-Natal (2,783,051)
Median: 956,836 teachers (middle value)
Analysis: The mean gives a better indication because it accounts for the extreme values (KwaZulu-Natal and Northern Cape), providing a more comprehensive view of teacher distribution.
Exam tips
Essential exam strategies:
- Always calculate all measures when possible and compare them
- Look for outliers in your data - they heavily affect the mean but not the median
- For categorical data (like food preferences), only the mode makes sense
- Show all working steps clearly in calculations
- Round answers appropriately (usually to 2 decimal places for money)
- State which measure is most appropriate and explain why
Key Points to Remember:
- Mean = sum of all values ÷ number of values (best when no outliers)
- Median = middle value in ordered data (best when outliers are present)
- Mode = most frequently occurring value (best for categorical data)
- Range = highest value - lowest value (shows data spread)
- Always consider outliers when choosing which measure to use - they can make the mean unrealistic while the median stays reliable