Break-Even Analysis (Grade 11 NSC Matric Mathematical Literacy): Revision Notes
Break-Even Analysis
What is break-even?
Break-even point represents the exact moment when a business covers all its expenses without making a profit or loss. At this critical point, the total income from sales equals the total costs of running the business.
Understanding break-even is essential for any business because it provides crucial financial insights that determine business viability and planning strategies.
Understanding break-even is essential for any business because it shows:
- How many products must be sold to cover all costs
- The minimum income needed to avoid making a loss
- When the business will start generating profit
Beyond business contexts, break-even can also refer to situations where two options become equally valuable, such as comparing different cell phone contracts or electricity usage systems.
Break-even has two values
Break-even analysis always produces two related values that work together to show the complete break-even picture.
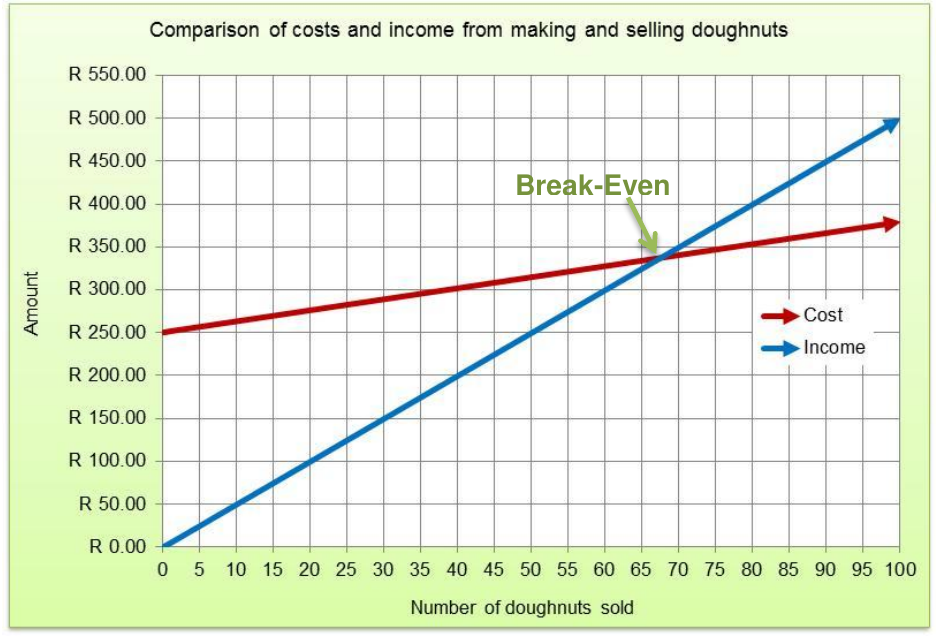
Looking at this doughnut business example, we can see how break-even works in practice:
The two break-even values are:
- Horizontal axis value: Number of doughnuts (approximately 67 doughnuts)
- Vertical axis value: Amount in Rand (approximately R340)
This means the business breaks even when:
- 67 doughnuts are sold, AND
- Both income and costs equal R340
Key insight: These two values always work as a pair. You cannot have a break-even point with just one value - you need both the quantity and the monetary amount.
Methods for determining break-even values
There are two main methods for finding break-even values:
Method 1: Graphical method
This involves:
- Drawing a graph with costs and income lines
- Finding where the two lines intersect
- Reading both values from the intersection point
The graph clearly shows the break-even point where the red cost line meets the blue income line.
Method 2: Trial and improvement
This mathematical approach uses equations and intelligent guessing with the following given information for the doughnut business:
- Income per doughnut = R5.00
- Fixed cost (stall rental) = R250.00
- Variable cost per doughnut = R1.30
Formulas:
- Income = R5.00 × number of doughnuts
- Total cost = R250.00 + (R1.30 × number of doughnuts)
Worked examples using trial and improvement
Worked Example 1: Testing 100 doughnuts
- Income = R5.00 × 100 = R500.00
- Cost = R250.00 + (R1.30 × 100) = R250.00 + R130.00 = R380.00
- Result: Income > Cost (profit situation)
Worked Example 2: Testing 50 doughnuts
- Income = R5.00 × 50 = R250.00
- Cost = R250.00 + (R1.30 × 50) = R250.00 + R65.00 = R315.00
- Result: Income < Cost (loss situation)
Worked Example 3: Refining the estimate
Since 50 doughnuts gives a loss and 100 doughnuts gives a profit, the break-even point lies between these values. Through continued testing, we find that approximately 68 doughnuts will give us the break-even point.
Verification:
- Income = R5.00 × 68 = R340.00
- Cost = R250.00 + (R1.30 × 68) = R250.00 + R88.40 = R338.40
- These values are approximately equal, confirming our break-even point.
Key formulas to remember
For any break-even analysis:
Exam tips
Critical exam strategies:
- Always express break-even as two values (quantity and amount)
- Show all working when using trial and improvement
- Read graph coordinates carefully for both axes
- Check your answer makes sense in the business context
- Remember that break-even means no profit and no loss
Summary
Key Points to Remember:
-
Break-even point occurs when total income equals total costs - the business makes neither profit nor loss
-
Break-even always has two values - one from the horizontal axis (quantity) and one from the vertical axis (monetary amount)
-
Two methods exist: graphical intersection method and trial and improvement using equations
-
Trial and improvement requires testing different quantities until income and costs are approximately equal
-
Break-even analysis helps businesses determine minimum sales targets needed to avoid losses