Representations for Determining Possible Outcomes (Grade 11 NSC Matric Mathematical Literacy): Revision Notes
Representations for Determining Possible Outcomes
When working with probability, you often encounter situations involving multiple events where it's difficult to see all possible outcomes clearly. Two powerful tools help you organize and understand these complex situations: tree diagrams and two-way tables. These representations make it easier to visualize all possible results and calculate their probabilities accurately.
Tree diagrams
A tree diagram is a visual representation that displays all possible outcomes when two or more events happen in sequence. It gets its name because it looks like a branching tree, with each branch representing a different possible path of events.
Key features of tree diagrams
Tree diagrams have several important characteristics that make them effective tools:
- Branches represent different outcomes - Each line extending from a point shows a possible result of an event
- Probability values are included - Every branch displays the probability of that specific outcome occurring
- Sequential structure - Multiple levels of branches show events happening one after another
- Complete outcome listing - All possible combinations of results appear at the final level
When constructing tree diagrams, always work from left to right, with the first event on the left and subsequent events branching out to the right. This maintains the logical flow of sequential events.
How to read a tree diagram
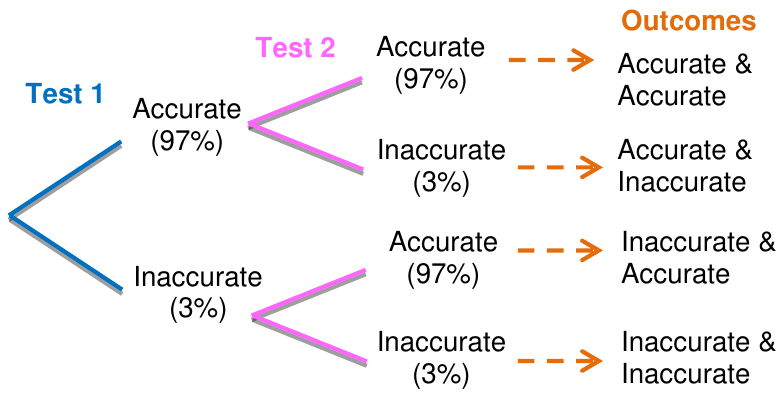
Using the diagnostic test example shown above, here's how to interpret each part:
First level (Test 1): The diagram begins with two branches representing the initial test results:
- Accurate (97% probability)
- Inaccurate (3% probability)
Second level (Test 2): From each first-level outcome, two additional branches appear, showing the second test can also be:
- Accurate (97% probability)
- Inaccurate (3% probability)
Final outcomes: The diagram shows four possible combinations:
- Accurate & Accurate
- Accurate & Inaccurate
- Inaccurate & Accurate
- Inaccurate & Inaccurate
Why tree diagrams are valuable
Tree diagrams provide several critical advantages for probability work:
- Help you see every possible outcome without missing any combinations
- Make complex probability situations easier to understand
- Allow you to calculate probabilities of specific outcome sequences
- Provide a systematic approach to organizing information
Exam tip: Always ensure probabilities from branches at the same level add up to 1 (or 100%). Label each branch clearly with both the outcome name and its probability value.
Two-way tables
A two-way table (also called a contingency table) is a data table that compares two different variables, allowing you to examine information in both horizontal and vertical directions. These tables are particularly useful for calculating probabilities and making predictions about events.
Understanding two-way table structure
Two-way tables organize information by showing relationships between two variables:
- Rows represent one variable (such as vehicle types)
- Columns represent another variable (such as provinces)
- Cell values show how the two variables intersect
- Row and column totals provide summary information
Converting actual values to probability values
To use two-way tables for probability calculations, you need to convert raw numbers into percentage probability values using this formula:
Formula:
Worked Example 1: Basic Conversion
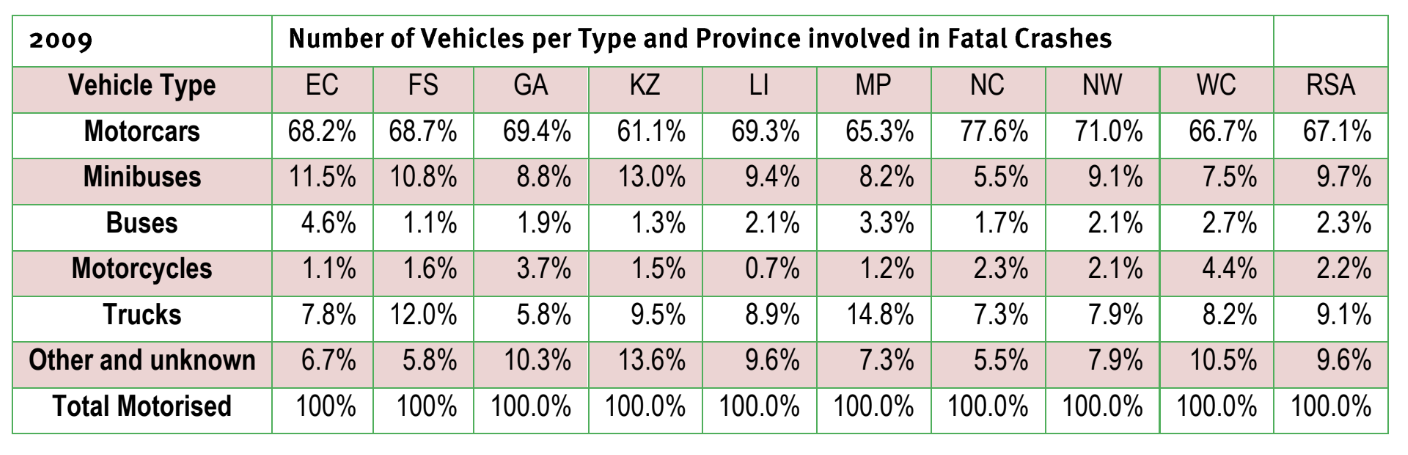
Suppose a crash statistics table shows 969 motorcars were involved in crashes in the Eastern Cape, out of 15,318 total vehicles nationwide.
Step 1: Identify the values
- Individual value = 969 (motorcars in Eastern Cape)
- Total value = 15,318 (all vehicles nationwide)
Step 2: Apply the formula
Interpretation: There's a 6.3% probability that a randomly selected vehicle from the national crash data would be a motorcar from the Eastern Cape.
Critical consideration: Which total to use
One of the most important aspects of working with two-way tables is understanding which total value to use in your calculations. The same data can produce different probability values depending on your choice of total.
Worked Example 2: Different Totals, Different Meanings
Using the same crash data, consider these different approaches:
Method 1 - National percentage:
Method 2 - Provincial percentage: If the Eastern Cape had 1,420 total crash vehicles:
Different meanings:
- The 6.3% tells you what portion of all national crash vehicles were Eastern Cape motorcars
- The 68.2% tells you what portion of Eastern Cape crash vehicles were motorcars
Converting tables for probability work
When preparing two-way tables for probability calculations, follow these steps:
Step 1: Start with the actual values table showing real numbers Step 2: Choose your total value carefully (grand total, row total, or column total) Step 3: Convert each relevant cell using the probability formula Step 4: Create a new table showing percentage probability values Step 5: Verify your calculations make sense in context
Worked Example 3: Complete Conversion
Original data: Buses involved in crashes
- Eastern Cape: 66 buses
- National total: 354 buses
- All vehicles national total: 15,318
For bus-specific analysis (using 354 as total): of all bus crashes occurred in Eastern Cape
For general crash analysis (using 15,318 as total): of all vehicle crashes were Eastern Cape buses
Important warnings for two-way tables
Critical Points to Avoid Common Mistakes:
- Always identify your total clearly - The meaning of your probability values depends entirely on which total you use
- Check your calculations - Ensure percentages based on the same total add up to 100%
- Understand the question - Different questions require different total values
- State your assumptions - Be clear about what your probability values represent
Exam tip: When working with two-way tables, write down explicitly which total you're using and what your final percentage represents. This prevents confusion and helps you choose the correct approach.
Key Points to Remember:
- Tree diagrams show all possible outcomes of sequential events using a branching structure with probability values
- Two-way tables compare relationships between two variables and can be converted to show probability information
- Both tools help you organize complex probability situations systematically
- Converting to percentage probability values requires the formula:
- The choice of total value in two-way tables completely changes the meaning of your probability calculations