Exponential Functions (Grade 11 NSC Matric Mathematics): Revision Notes
Exponential Functions
Introduction to exponential functions
Exponential functions are mathematical functions that involve a constant base raised to a variable power. These functions model situations involving rapid growth or decay, such as population growth, radioactive decay, or compound interest calculations.
The general form of an exponential function is:
Where:
- a is a constant that affects the shape and orientation of the graph
- b is the base (where and )
- x is the variable in the exponent
- q is a constant that creates a vertical shift
For the function to be properly defined as exponential, we require to ensure real number outputs for all values of x.
Effects of the parameters a, b, and q
Understanding how each parameter affects the graph helps you sketch exponential functions accurately and interpret their behaviour.
Effect of parameter q (vertical shift)
The parameter q controls the vertical position of the entire graph:
- When : The graph shifts upwards by q units
- When : The graph shifts downwards by q units
- The horizontal asymptote is always the line
The horizontal asymptote represents the value that the function approaches but never actually reaches as x approaches positive or negative infinity.
Effect of parameter a (shape and orientation)
The parameter a determines both the shape and orientation of the exponential curve:
- When : The function is increasing (rises from left to right)
- When : The function is decreasing (falls from left to right), and the graph reflects about the horizontal asymptote
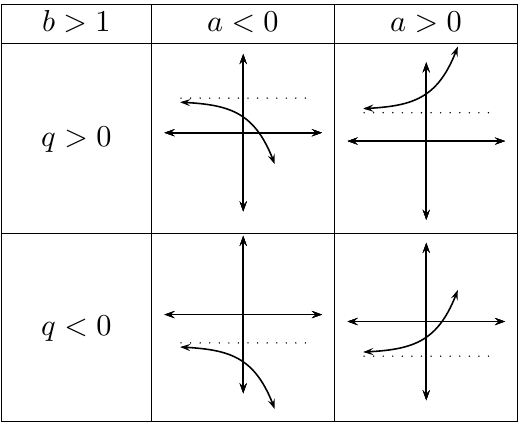
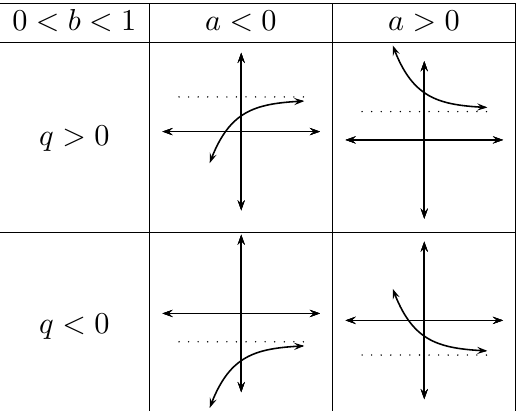
Effect of parameter b (growth or decay direction)
The base b determines whether the function represents growth or decay:
- When : The function represents exponential growth (assuming )
- When : The function represents exponential decay (assuming )
- When : The function is not properly defined as an exponential function
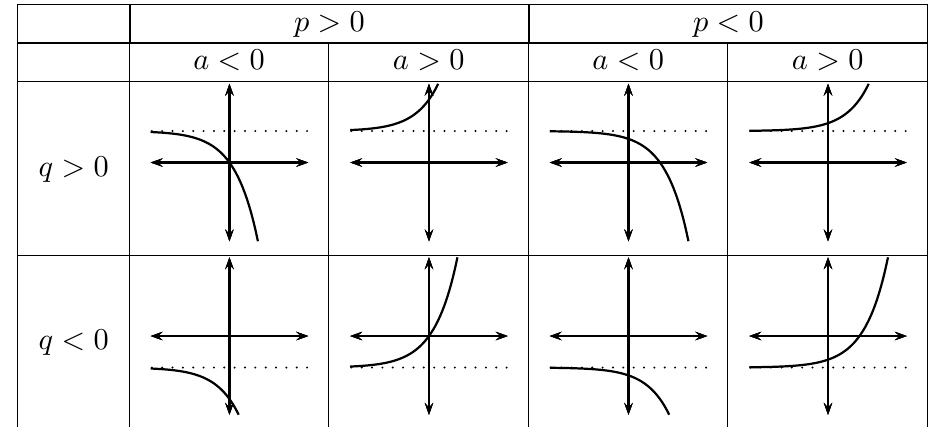
Extended form with horizontal shifts
Exponential functions can also include horizontal shifts using the extended form:
Effect of parameter p (horizontal shift)
The parameter p creates a horizontal shift of the entire graph:
- When : The graph shifts to the left by p units
- When : The graph shifts to the right by p units
This horizontal shift affects all points on the graph equally, moving the entire curve without changing its shape or asymptote.
Key characteristics of exponential functions
Domain and range
For exponential functions of the form :
Domain: The domain is always because exponential functions are defined for all real numbers.
Range: The range depends on the sign of parameter (a):
- If (a > 0): Range is
- If (a < 0): Range is
Worked Example: Finding Domain and Range
Question: State the domain and range for .
Solution:
Step 1: Determine the domain
The domain is because there is no value of x for which is undefined.
Step 2: Determine the range
Since for all real x, we have:
- Therefore
The range is or in interval notation .
Intercepts
y-intercept: To find the y-intercept, substitute into the function.
For example, if :
This gives the point .
x-intercept: To find the x-intercept, set and solve for x.
For the same function:
Solving: , which gives
Since exponential functions with positive bases cannot equal negative values, this function has no x-intercept.
Asymptotes
All exponential functions of the form have a horizontal asymptote at .
Worked Example: Finding Asymptotes
Question: Determine the asymptote for .
Solution:
The asymptote occurs where the exponential term approaches its limit:
- As :
- Therefore:
The asymptote is the line .
Sketching exponential graphs
To sketch an exponential function , follow these steps:
- Identify the shape: Determine if the function is increasing or decreasing based on the signs of a and the value of b
- Find the y-intercept: Substitute
- Find the x-intercept: Set and solve (if possible)
- Identify the asymptote: The horizontal asymptote is
- Determine domain and range: Use the rules based on parameter a
- Plot key points and sketch: Draw the curve approaching the asymptote
Worked Example: Complete Graphing
Question: Sketch the graph of .
Solution:
Step 1: Rewrite in standard form
Here and , so the function is increasing.
Step 2: Find the y-intercept
Point:
Step 3: Find the x-intercept
Point:
Step 4: Identify the asymptote
The horizontal asymptote is
Step 5: State domain and range
Domain:
Range:
Working backwards from graphs
Sometimes you need to find the equation of an exponential function from its graph.
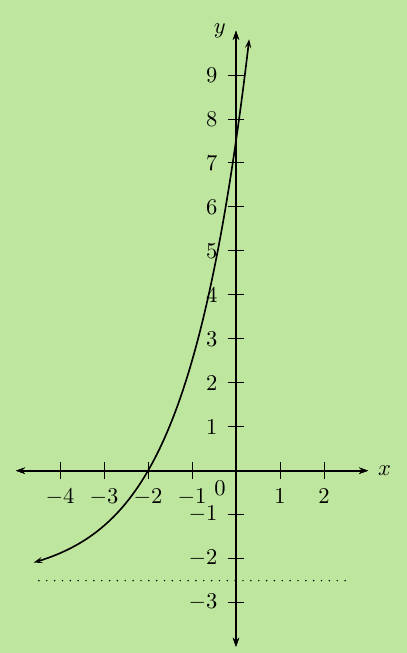
Worked Example: Finding Equation from Graph
Use the given graph of to determine the values of p and q.
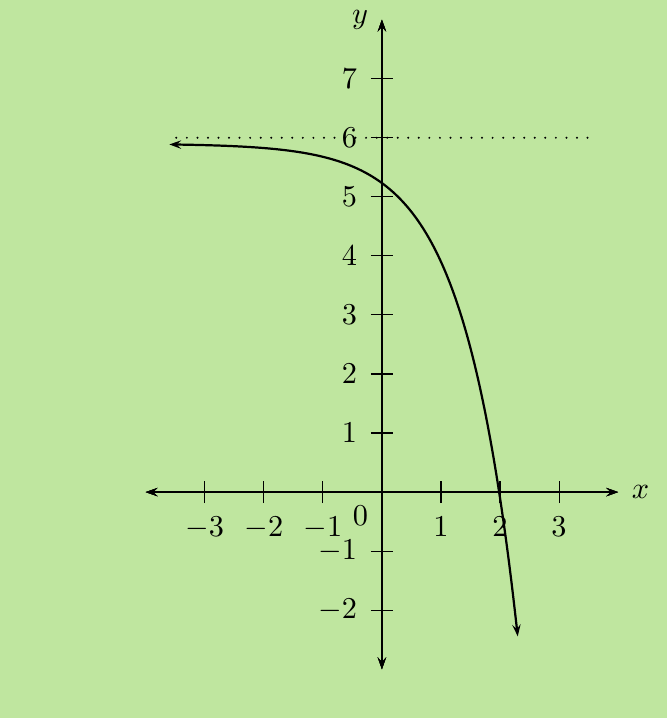
Solution:
Step 1: Use the asymptote to find q
From the graph, the horizontal asymptote is , so .
The equation becomes:
Step 2: Use a point to find p
The graph passes through . Substituting:
Final answer:
Common Exam Tips
- Always check your asymptote: The horizontal asymptote is simply the value of q
- Domain is always all real numbers: Exponential functions are defined everywhere
- Range depends on parameter a: Positive a means y > q, negative a means y < q
- Base must be positive: If b ≤ 0, the function is not a proper exponential function
- Use substitution carefully: When finding intercepts, substitute the correct values and solve step by step
Key Points to Remember:
- Exponential functions have the form where b > 0
- Parameter a controls the shape and orientation of the graph
- Parameter b determines growth (b > 1) or decay (0 < b < 1)
- Parameter p shifts the graph horizontally (left if p > 0, right if p < 0)
- Parameter q shifts the graph vertically and determines the horizontal asymptote y = q
- Domain is always all real numbers, but range depends on the sign of parameter a