More Venn Diagrams (Grade 11 NSC Matric Mathematics): Revision Notes
More Venn Diagrams
Introduction to three-event Venn diagrams
When working with complex probability problems, you often encounter three or more events that intersect in different ways. Three-event Venn diagrams are powerful tools that help you visualise and count the outcomes in various event combinations.
These diagrams show how three different events relate to each other within a sample space (S). The sample space contains all possible outcomes, while each circle represents a specific event.
Why use three-event Venn diagrams?
Three-event Venn diagrams are particularly useful when you need to:
- Visualise complex relationships between multiple events
- Count outcomes that belong to specific combinations of events
- Calculate probabilities involving intersections and unions of three sets
- Solve problems where events can overlap in multiple ways
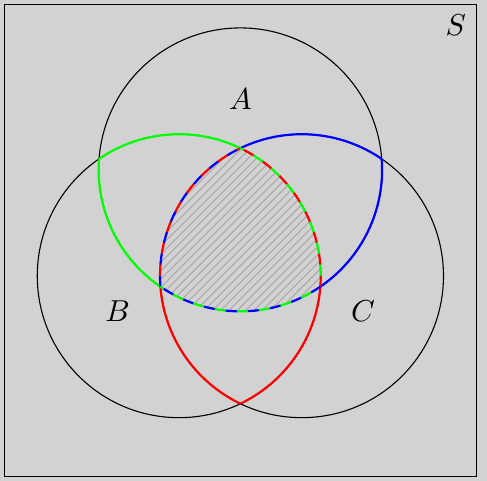
The diagram shows three overlapping circles labelled A, B, and C within a rectangle representing the sample space S. Each region represents a different combination of events, and the shaded central area shows where all three events intersect.
Understanding regions in Venn diagrams
In a three-event Venn diagram, different regions represent different combinations of events:
- Individual circles: Outcomes that belong to only one event
- Two-circle intersections: Outcomes that belong to exactly two events
- Three-circle intersection: Outcomes that belong to all three events
- Outside all circles: Outcomes that belong to none of the events but are still in the sample space
Systematic Region Analysis
When analyzing Venn diagrams, always work systematically through each region. Start with the most specific (three-way intersection) and work outward to the least specific (outside all circles). This helps ensure you don't miss any outcomes or double-count.
Step-by-step process for creating Venn diagrams
Step 1: Define the sample space and event sets
Start by clearly identifying what your sample space contains and what each event represents. Write out the elements or conditions for each set.
Step 2: Draw the outline structure
Create three overlapping circles within a rectangle. Label the rectangle with S for the sample space, and label each circle with the appropriate event letter.
Step 3: Place outcomes in appropriate regions
Systematically work through each outcome and determine which events it belongs to, then place it in the correct region of the diagram.
Critical Success Factor
The key to creating accurate Venn diagrams is working systematically through every single outcome in your sample space. Missing even one outcome or placing it in the wrong region can lead to incorrect probability calculations. Always double-check your work by ensuring all outcomes are accounted for.
Worked example 1: Numbers with different properties
Worked Example: Number Properties
Question: Create a Venn diagram showing the sample space and events where:
- S: all integers from 1 to 30
- P: prime numbers
- M: multiples of 3
- F: factors of 30
Solution:
Step 1: Write down the event sets
The sample space contains all positive integers up to 30:
The prime numbers between 1 and 30 are:
The multiples of 3 between 1 and 30 are:
The factors of 30 are:
Step 2: Draw the Venn diagram outline
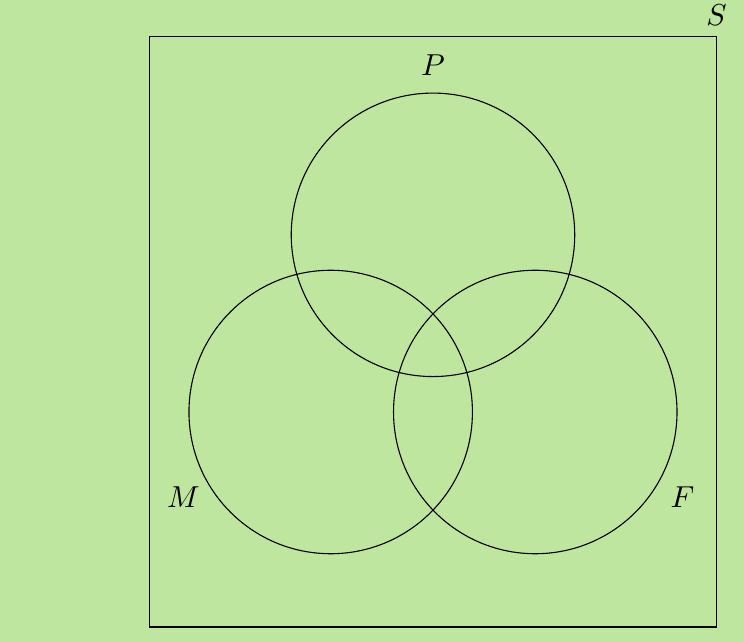
Step 3: Place the outcomes in the appropriate regions
Work through each number from 1 to 30 and determine which events it belongs to, then place it in the correct region.
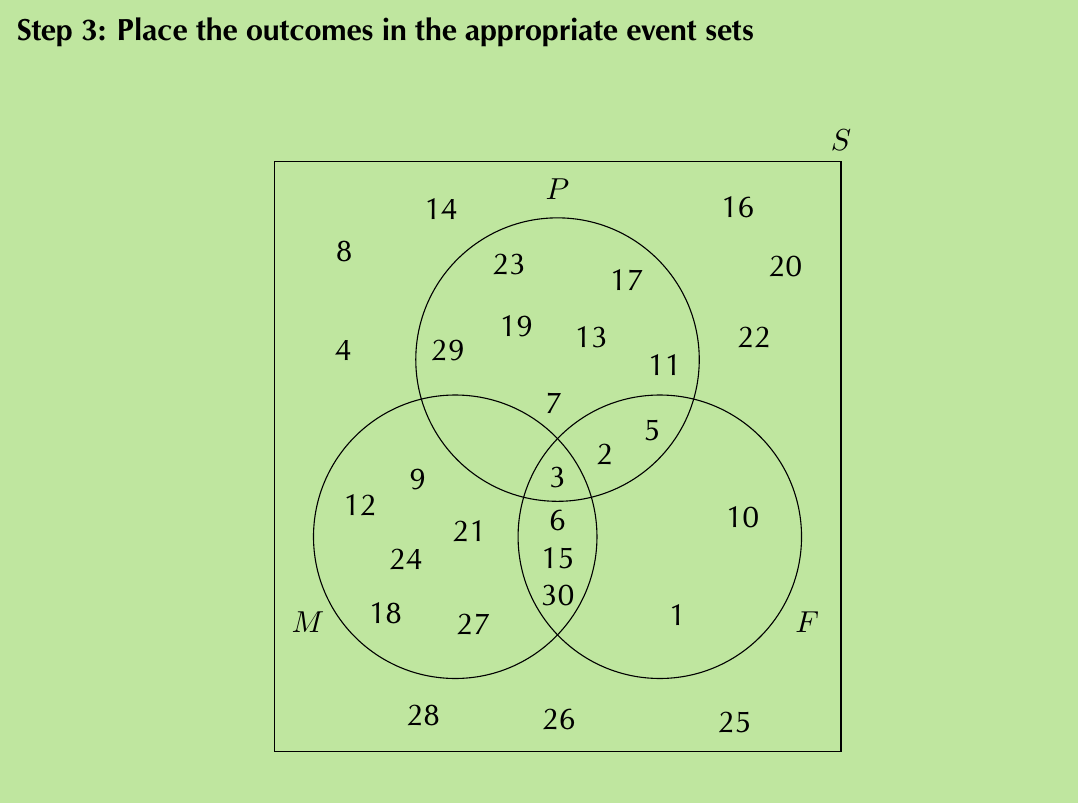
This completed diagram shows how the numbers 1 to 30 are distributed across the different combinations of being prime, multiples of 3, or factors of 30.
Worked example 2: Students taking subjects
Worked Example: Student Subject Selection
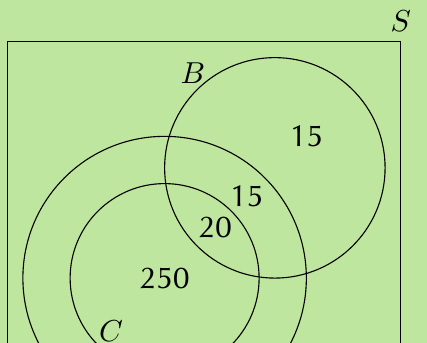
Question: At Dawnview High there are 400 Grade 11 learners. 270 do Computer Science, 300 do English and 50 do Business studies. All learners doing Computer Science also do English, 20 take Computer Science and Business studies, and 35 take English and Business studies. Calculate probabilities for a randomly selected student.
Solution:
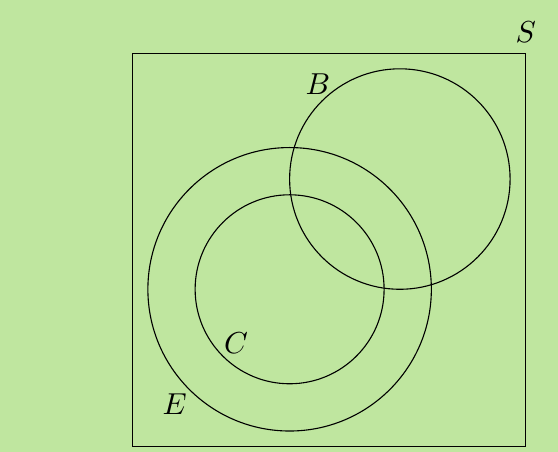
Step 1: Draw the Venn diagram outline
Since all Computer Science students also do English, the Computer Science circle must be completely inside the English circle.
Step 2: Fill in the counts
Using the given information, we can determine the number of students in each region:
Step 3: Calculate probabilities
To find specific probabilities, identify the relevant region and divide by the total number of students (400).
For example:
Key terminology and symbols
Understanding the language used in Venn diagram problems is crucial for identifying which regions to use. The wording of probability questions will determine exactly which part of your diagram you need to focus on.
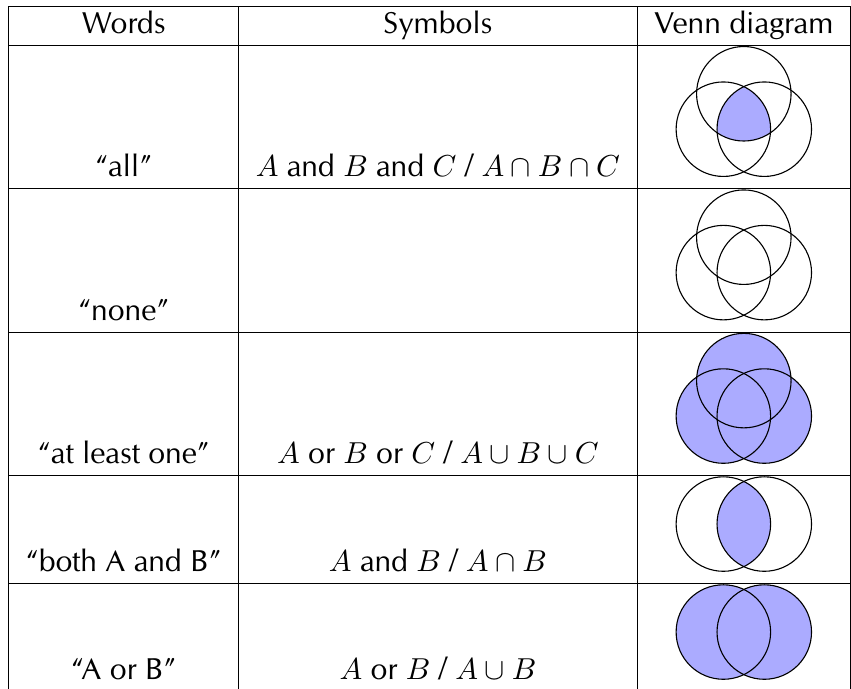
Key terms you need to know:
- "All": The intersection of all events () - only the central region
- "None": Outside all circles - no events occur
- "At least one": The union of all events () - anywhere inside any circle
- "Both A and B": The intersection - where circles A and B overlap
- "A or B": The union - anywhere in circle A or circle B
Language is Critical
Mathematical language is precise, and small changes in wording can completely change which region of your Venn diagram you need to use. Always read questions carefully and identify the exact mathematical operation being described before attempting calculations.
Calculating probabilities from Venn diagrams
Once your diagram is complete, calculating probabilities becomes straightforward. The visual representation makes it easy to identify exactly which outcomes satisfy the conditions in your probability question.
The process follows these steps:
- Identify the relevant region based on the question wording
- Count the outcomes in that region
- Divide by the total number of outcomes in the sample space
Probability Formula
Remember that probability is always:
This formula applies whether you're working with numbers, objects, people, or any other type of outcome. The key is correctly identifying which outcomes are "favourable" based on the question wording.
Key Points to Remember:
- Three-event Venn diagrams help visualise complex relationships between multiple events within a sample space
- Always start by clearly defining your sample space and individual event sets before drawing
- "All" means the central intersection where all three circles overlap
- "At least one" means the union of all events (anywhere inside any circle)
- "Both A and B" refers specifically to the intersection of those two events only
- Probability calculations are straightforward once you correctly identify the relevant region in your diagram
- Mathematical language is precise - small changes in wording can completely change which region to use