Revision (Grade 11 NSC Matric Mathematics): Revision Notes
Revision
Introduction to probability
Probability is a branch of mathematics that deals with measuring the likelihood of uncertain events occurring. Understanding probability helps us make informed decisions and predictions about random processes in everyday life.
Probability concepts appear everywhere in daily life - from weather forecasts to medical diagnoses to sports predictions. Mastering these fundamentals will help you understand and analyze uncertainty in many real-world situations.
Key terminology
Outcome
An outcome refers to a single result of an uncertain or random process, also called an experiment. When you roll a die, each possible number (1, 2, 3, 4, 5, or 6) represents a different outcome.
Sample space
The sample space contains all possible outcomes of an experiment. It represents every single result that could occur. For a coin flip, the sample space is {heads, tails}. For rolling a standard die, the sample space is {1, 2, 3, 4, 5, 6}. The sample space is represented by the letter S.
Event
An event consists of one or more outcomes from an experiment. Events are subsets of the sample space. For example, when rolling a die, "getting an even number" is an event that includes the outcomes {2, 4, 6}.
Think of events as questions you might ask about an experiment. "Will it rain tomorrow?" "Will the coin land on heads?" "Will I roll a number greater than 4?" Each of these questions defines an event.
Probability of an event
Probability measures how likely an event is to occur, expressed as a number between 0 and 1. A probability of 0 means the event will never happen, while a probability of 1 means the event will definitely happen. When all outcomes have equal chances of occurring, probability equals the number of favourable outcomes divided by the total number of possible outcomes.
Relative frequency
Relative frequency shows how often an event occurs during experimental trials. It equals the number of times the event happens divided by the total number of trials conducted. If you flip a coin 20 times and get heads 8 times, the relative frequency of heads is .
Union of events
The union of events includes all outcomes that occur in at least one of the events. For events A and B, we write the union as "A or B" or using set notation: .
Intersection of events
The intersection of events includes all outcomes that occur in all of the events simultaneously. For events A and B, we write the intersection as "A and B" or using set notation: .
Mutually exclusive events
Mutually exclusive events share no common outcomes and cannot occur simultaneously. When events A and B are mutually exclusive, their intersection equals the empty set: . For example, when rolling a die, getting an odd number and getting an even number are mutually exclusive events.
Complementary events
Complementary events are two mutually exclusive events that together include all outcomes in the sample space. For event A, we write its complement as "not A" or . The event and its complement always have probabilities that sum to 1.
Critical Concept: Understanding the difference between mutually exclusive and complementary events is essential. Mutually exclusive events cannot happen together, but complementary events are mutually exclusive AND they cover the entire sample space together.
Probability rules and identities
These fundamental rules form the foundation of probability calculations and must be mastered for solving complex problems.
Addition rule (general)
For any two events A and B:
This rule helps calculate the probability that at least one of two events occurs. We subtract the intersection to avoid counting shared outcomes twice.
Addition rule for mutually exclusive events
When events A and B are mutually exclusive:
Since mutually exclusive events cannot occur together, , simplifying the general addition rule.
Complementary rule
For any event A:
This rule helps calculate the probability that an event does not occur. Since A and "not A" are complementary events, their probabilities must sum to 1.
Worked example: Card selection
Worked Example: Probability with Playing Cards
Question: You take all hearts from a deck of cards and select one randomly. What is the sample space? What is the probability of each event?
- The card is the ace of hearts
- The card has a prime number
- The card has a letter of the alphabet
Solution:
Step 1: Identify the sample space Since we only consider hearts, the sample space includes the letters and numbers on heart cards:
Step 2: Define the event sets
- Ace of hearts:
- Prime number:
- Letter of alphabet:
Step 3: Calculate probabilities The sample space contains 13 elements, so:
Worked example: Rolling two dice
Worked Example: Two-Dice Probability
Question: Roll two 6-sided dice. Let E be the event that the total equals 10. Let F be the event that at least one die shows 3. Find the probabilities and determine if the events are mutually exclusive.
Solution:
Step 1: Determine the sample space Rolling two dice creates possible outcomes:
Step 2: Define the events
- Event E (total equals 10):
- Event F (at least one die shows 3):
Step 3: Calculate probabilities
Step 4: Test for mutual exclusivity Since event E contains no outcomes with a 3, the intersection of E and F is empty. Therefore, E and F are mutually exclusive events.
Venn diagrams in probability
Venn diagrams provide visual representations of relationships between events. Each event appears as a shape (usually a circle), with the sample space shown as a rectangle. The region inside a shape represents outcomes included in that event, while regions outside represent outcomes not in the event.
Venn diagrams are particularly powerful for visualizing complex probability problems involving multiple events. They help you organize information systematically and avoid common counting errors.
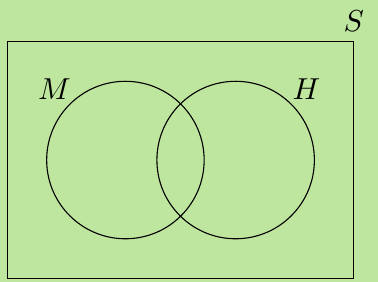
This basic Venn diagram shows two events M and H within sample space S, with their intersection clearly visible.
Using Venn diagrams for calculations
Venn diagrams help solve complex probability problems by organizing information visually. You can represent:
- Individual outcomes in each region
- Counts of outcomes in each region
- Probabilities for each region
Worked example: Venn diagram with outcomes
Worked Example: Venn Diagram Analysis
Question: Choose a number between 1 and 20. Draw a Venn diagram to find:
- P(multiple of 3)
- P(multiple of 5)
- P(multiple of 3 or 5)
- P(multiple of 3 and 5)
Solution:
Step 1: Set up the Venn diagram
- Sample space:
- Event A (multiples of 3):
- Event B (multiples of 5):
- Intersection (multiples of both):
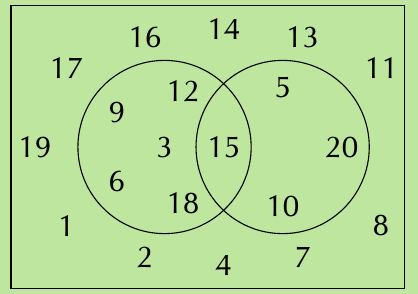
Step 2: Calculate probabilities With 20 total outcomes:
- (using union)
- (intersection only)
Worked example: Venn diagram with counts
Worked Example: Survey Data Analysis
Question: In a group of 50 learners, 35 take Mathematics, 30 take History, and 12 take neither subject. Find the probability that a randomly chosen learner takes both subjects.
Solution:
Step 1: Set up the problem
- Total learners: 50
- Mathematics (M): 35 learners
- History (H): 30 learners
- Neither subject: 12 learners
Step 2: Find the intersection
Learners taking at least one subject:
Using the addition rule:
Therefore:
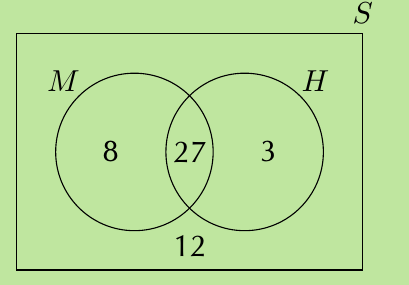
Step 3: Calculate the probability
Using probability tables
Data can be organized in tables to help calculate probabilities. Consider this table showing colored blocks:
| Colour | Purple | Orange | White | Pink |
|---|---|---|---|---|
| Number of blocks | 24 | 32 | 41 | 19 |
With a total of 116 blocks, you can calculate:
Tables are excellent for organizing data when dealing with real-world probability problems. Always check that your categories are complete and mutually exclusive when setting up probability tables.
Key Points to Remember:
-
Probability always lies between 0 and 1 - impossible events have probability 0, certain events have probability 1
-
Use the addition rule carefully - subtract the intersection when events can overlap, but for mutually exclusive events, just add the individual probabilities
-
Complementary events are powerful - sometimes it's easier to calculate rather than finding directly
-
Venn diagrams clarify complex problems - they help visualize relationships between events and organize information systematically
-
Always define your sample space first - this prevents errors and ensures you account for all possible outcomes