Statistics (Grade 11 NSC Matric Mathematics): Revision Notes
Variance and Standard Deviation
Introduction to dispersion measures
When we analyse data, measures of central tendency (mean, median, mode) tell us the typical value in a dataset.
However, they do not tell us how spread out the data is.
This is why we use measures of dispersion — variance and standard deviation — which describe how much data values vary from the mean.
Understanding variance
Definition of variance
Variance is the average squared distance between each data value and the mean.
For a population of elements
with mean :
Properties of variance
-
Always non-negative
Squaring deviations ensures the result cannot be negative. -
Measured in squared units
If data is in , variance is in . -
Shows spread
- Large variance ( large) → data widely spread
- Small variance ( small) → data clustered close to the mean
Worked example: Calculating variance
Worked Example: Variance of Coin Flip Results
Data (number of heads in trials):
Step 1: Calculate the mean
Step 2: Calculate the variance
Compute each , then average:
Understanding standard deviation
Definition of standard deviation
Standard deviation is the square root of the variance, so it has the same units as the original data:
Properties of standard deviation
- Same units as data
- Always positive (or if all values are identical)
- Measures typical distance from the mean
- Easy to interpret (small = low spread, large = high spread)
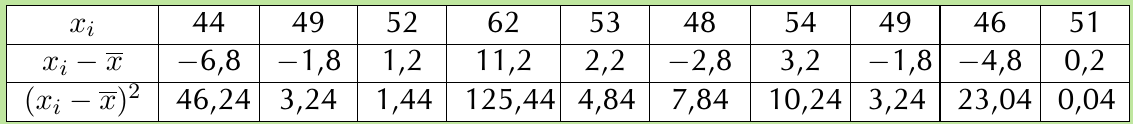
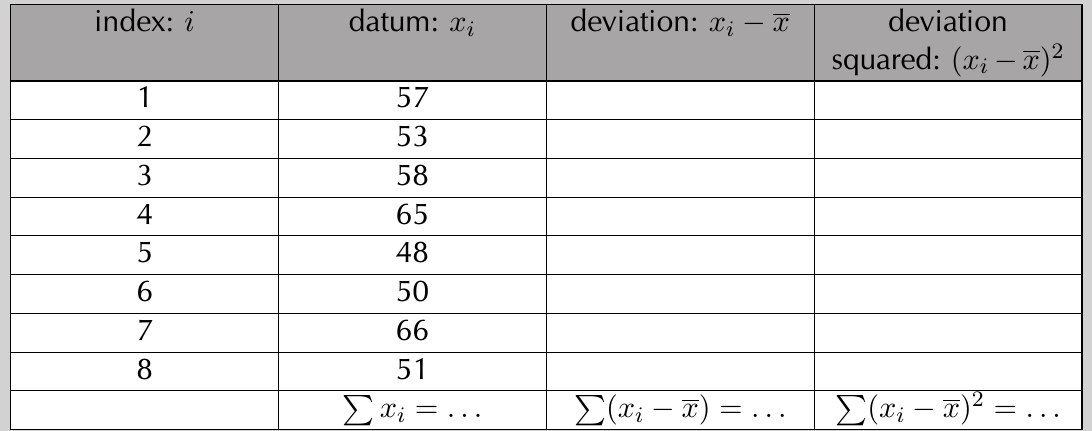
Using a table
A table helps avoid arithmetic errors:
Worked example: Variance & SD of a die roll
Worked Example: Rolling a Fair Die
Step 1: Data
Step 2: Mean
Step 3: Variance
Step 4: Standard deviation
Interpretation and applications
Comparing datasets
Three datasets may share the same mean but differ in spread.
- Small SD → tightly clustered
- Medium SD → moderately spread
- Large SD → widely scattered
(Visuals shown above.)
Real-world applications
- Quality control: consistency of manufactured products
- Scientific measurement: low SD → high precision
- Finance: SD measures volatility (risk)
- Education: SD shows consistency of scores
Exam tips
- Always calculate the mean first
- Variance uses squared units, SD uses original units
- Use tables to avoid calculation errors
- Larger → more spread
- Smaller → tighter clustering
Remember!
-
Variance measures average squared distance:
-
Standard deviation is the square root:
-
Large values (, ) → more spread
-
Small values (, ) → less spread
-
Always:
- Calculate the mean
- Find deviations
- Square deviations
- Average them (variance)
- Take the square root (standard deviation)
-
Use tables to organise calculations clearly.