Revision (Grade 11 NSC Matric Mathematics): Revision Notes
Revision
Measures of central tendency
Central tendency measures help us find the centre or typical value of a dataset. The two main measures are the mean and median.
Mean
The mean (or average) represents the typical value when all data values are added together and divided by the number of values.
Formula for mean:
Where:
- are the individual data values
- is the total number of data values
- is read as "x bar"
Median
The median is the middle value when data is arranged in order from smallest to largest.
How to find the median:
- Sort the data from smallest to largest
- Find the middle position
- If there's an odd number of values, the median is the middle value
- If there's an even number of values, the median is the average of the two middle values
Worked Example: Computing measures of central tendency
Question: Compute the mean and median of the following dataset: 72,5 ; 92,6 ; 15,6 ; 53,0 ; 86,4 ; 89,9 ; 90,9 ; 21,7 ; 46,0 ; 4,1 ; 51,7 ; 2,2
Solution:
Step 1: Calculate the mean
First, add all values together and divide by the number of values (12):
Step 2: Calculate the median
First, sort the data in ascending order:
- 2,2 ; 4,1 ; 15,6 ; 21,7 ; 46,0 ; 51,7 ; 53,0 ; 72,5 ; 86,4 ; 89,9 ; 90,9 ; 92,6
Since there are 12 values (even number), the median lies between the 6th and 7th values.
The middle values are 51,7 and 53,0.
Therefore: Median =
Measures of dispersion
Dispersion measures tell us how spread out the data is. A small measure of dispersion means data points are clustered close together. A large measure means data points are spread out over a wider range.
Range
The range is the difference between the maximum and minimum values in the dataset.
Formula: Range = Maximum value - Minimum value
Inter-quartile range
The inter-quartile range (IQR) is the difference between the first quartile (Q₁) and third quartile (Q₃). This measures the spread of the middle 50% of the data.
Understanding quartiles:
- First quartile (Q₁): The value that is one-quarter of the way through the ordered dataset
- Second quartile (Q₂): The median (halfway through the dataset)
- Third quartile (Q₃): The value that is three-quarters of the way through the dataset
Formula: IQR = Q₃ - Q₁
Worked Example: Range and inter-quartile range
Question: Determine the range and inter-quartile range of the following dataset: 14 ; 17 ; 45 ; 20 ; 19 ; 36 ; 7 ; 30 ; 8
Solution:
Step 1: Sort the data
Ordered dataset: 7 ; 8 ; 14 ; 17 ; 19 ; 20 ; 30 ; 36 ; 45
Step 2: Find range
- Minimum value = 7
- Maximum value = 45
- Range = 45 - 7 = 38
Step 3: Find quartiles and IQR
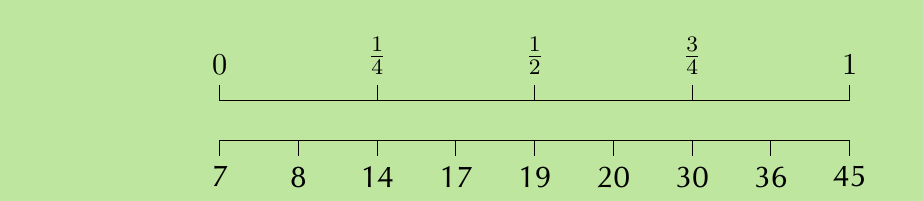
From the quartile positions:
- Q₁ = 14 (first quartile)
- Q₂ = 19 (median)
- Q₃ = 30 (third quartile)
Inter-quartile range = Q₃ - Q₁ = 30 - 14 = 16
Five number summary
The five number summary provides a complete overview of a dataset by combining central tendency and dispersion measures. It consists of five key values listed in order:
Five number summary components:
- Minimum: The smallest value
- First quartile (Q₁): The value at the 25th percentile
- Median (Q₂): The middle value (50th percentile)
- Third quartile (Q₃): The value at the 75th percentile
- Maximum: The largest value
Box and whisker diagrams
The five number summary is often displayed visually using a box and whisker diagram (also called a box plot). This diagram shows the distribution and spread of data at a glance.
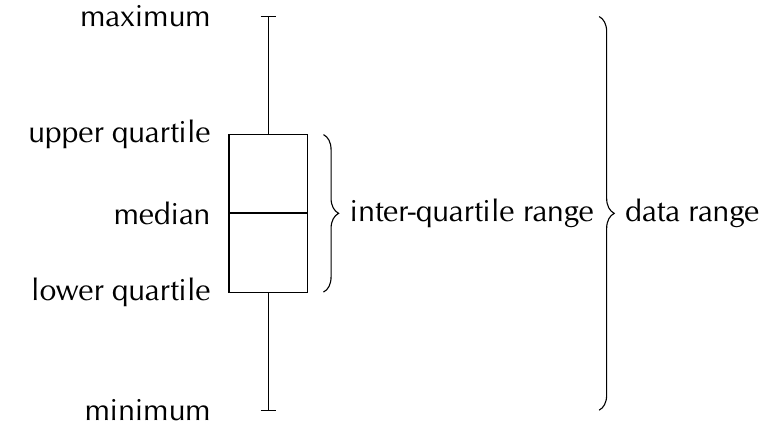
Components of a box plot:
- Box: Shows the inter-quartile range (from Q₁ to Q₃)
- Line inside box: Shows the median position
- Whiskers: Lines extending to the minimum and maximum values
- Data range: The total span from minimum to maximum
Worked Example: Five number summary
Question: Draw a box and whisker diagram for the following dataset: 1,25 ; 1,5 ; 2,5 ; 2,5 ; 3,1 ; 3,2 ; 4,1 ; 4,25 ; 4,75 ; 4,8 ; 4,95 ; 5,1
Solution:
Step 1: Identify minimum and maximum
- Minimum = 1,25
- Maximum = 5,1
Step 2: Calculate quartiles With 12 values in the dataset:
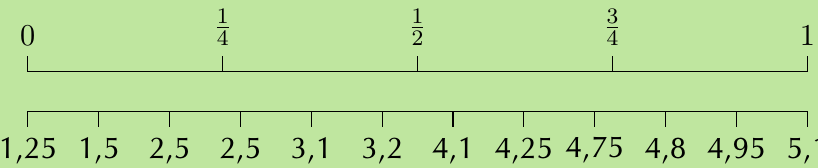
Using the quartile positions:
- Q₁ =
- Median =
- Q₃ =
Step 3: Five number summary
(1,25 ; 2,5 ; 3,65 ; 4,775 ; 5,1)
Step 4: Draw the box plot
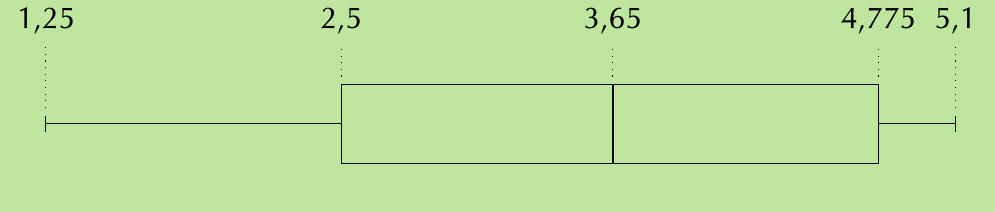
The box plot shows the five number summary visually, with the box representing the middle 50% of the data and whiskers extending to the extremes.
Exam tips
- Always sort data before finding median or quartiles
- For even numbers of data points, take the average of the two middle values for median
- Check your quartile calculations using the position method
- Box plots provide quick visual summaries of data distribution
- Range shows total spread; IQR shows spread of middle 50% of data
Key Points to Remember:
- Mean = sum of all values divided by number of values:
- Median = middle value of ordered data (or average of two middle values)
- Range = maximum - minimum value
- IQR = Q₃ - Q₁ (spread of middle 50% of data)
- Five number summary follows the order: minimum, Q₁, median, Q₃, maximum