Symmetric and Skewed Data (Grade 11 NSC Matric Mathematics): Revision Notes
Symmetric and Skewed Data
Introduction to distribution shapes
When we analyse data, we can classify the shape of data distributions into three main categories. This classification helps us understand how the data is spread out and where most values tend to cluster. We focus on unimodal distributions, which are distributions with only one peak or highest point.
The three categories we study are:
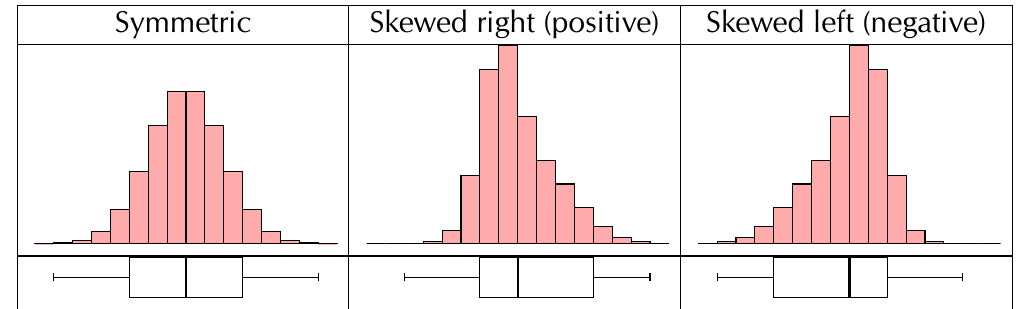
- Symmetric distributions
- Right-skewed distributions (also called positively skewed)
- Left-skewed distributions (also called negatively skewed)
Understanding these shapes helps us choose the right measures of central tendency and make better interpretations of our data.
The shape of a distribution tells us a story about our data. Symmetric data suggests balanced behavior, while skewed data indicates that extreme values are pulling the distribution in one direction.
Symmetric distributions
A symmetric distribution occurs when the left and right sides of the data are roughly equally balanced around the centre. Think of it like a mirror - if you folded the distribution in half at the centre, both sides would match almost perfectly.
Key characteristics of symmetric distributions
Relationship between mean and median:
- The mean is approximately equal to the median ()
- Both measures of central tendency are located at the centre of the distribution
- This happens because the data values are evenly spread on both sides
Visual features:
- Balanced tails: The left and right tails have approximately the same length
- The peak is in the centre of the distribution
- The frequency bars decrease gradually and equally on both sides
Box plot characteristics:
For symmetric data, the box plot shows a special pattern:
- The median line sits halfway between the first quartile (Q₁) and third quartile (Q₃)
- The whiskers (lines extending from the box) may not be exactly equal, but the overall distribution remains balanced
- The median represents the middle point of the entire dataset
Right-skewed distributions (positively skewed)
A right-skewed distribution has most of its data concentrated on the left side, with a longer tail stretching out to the right. This creates an unbalanced appearance where the majority of values are smaller, but a few larger values pull the distribution rightward.
Key characteristics of right-skewed distributions
Relationship between mean and median:
- The mean is greater than the median ()
- This occurs because the few large values in the right tail pull the mean toward higher values
- The median remains more resistant to these extreme values
Why the mean shifts in right-skewed data:
The mean is sensitive to extreme values because it uses every data point in its calculation. When we have a few unusually large values in the right tail, they add significantly to the total sum, pulling the mean away from the centre toward the larger values. The median, however, only depends on the middle position and isn't affected by how extreme the tail values are.
Visual features:
- Short left tail: The left side has fewer, more tightly packed values
- Long right tail: The right side stretches further out with gradually decreasing frequencies
- The peak appears on the left side of the distribution
Box plot characteristics:
- The median line is closer to the first quartile (Q₁) than to the third quartile (Q₃)
- The right whisker is typically longer than the left whisker
- This shows that the upper 25% of data is more spread out than the lower 25%
Left-skewed distributions (negatively skewed)
A left-skewed distribution has the opposite pattern to right-skewed data. Most values cluster on the right side, with a longer tail extending to the left.
Key characteristics of left-skewed distributions
Relationship between mean and median:
- The mean is less than the median ()
- The few small values in the left tail pull the mean toward lower values
- The median stays more centrally located among the majority of the data
Visual features:
- Long left tail: The left side extends further with decreasing frequencies
- Short right tail: The right side is more compact with most data values
- The peak appears on the right side of the distribution
Box plot characteristics:
- The median line is closer to the third quartile (Q₃) than to the first quartile (Q₁)
- The left whisker is typically longer than the right whisker
- This indicates the lower 25% of data is more spread out
Memory Aid: Remember the Direction
Think of skewness direction this way:
- Right-skewed = Positive skew = Mean moves right (mean > median)
- Left-skewed = Negative skew = Mean moves left (mean < median)
- Symmetric = Same on both sides = Same mean and median
The skew direction always points toward the longer tail!
Summary comparison
Quick Reference Table:
| Distribution Type | Mean vs Median | Tail Characteristics | Median Position in Box Plot |
|---|---|---|---|
| Symmetric | Balanced left and right tails | Halfway between Q₁ and Q₃ | |
| Right-skewed | Short left, long right tail | Closer to Q₁ | |
| Left-skewed | Long left, short right tail | Closer to Q₃ |
Exam tips for identifying distribution types
Quick Identification Strategies:
- Look at the tail lengths: The longer tail indicates the direction of skew
- Compare mean and median: Their relationship immediately tells you the distribution type
- Check the box plot: The median position within the box reveals the skewness
- Find the peak: In skewed distributions, the peak appears on the opposite side from the long tail
Common Mistake to Avoid: Don't confuse the direction of the peak with the direction of skew. The skew is named after the tail, not the peak!
Key Points to Remember:
-
Symmetric distributions have equal balance on both sides with and the median sits halfway between the quartiles
-
Right-skewed (positive) distributions have longer right tails, , and median closer to Q₁
-
Left-skewed (negative) distributions have longer left tails, , and median closer to Q₃
-
The direction of skew is determined by which tail is longer, not where the peak is located
-
Box plots provide a quick visual way to identify distribution type by looking at median placement and whisker lengths